

Kotak
Stockshaala
Chapter 2 | 3 min read
Volume Profile: The Market's X-Ray
Why does a stock slow down and stall when there is no obvious horizontal support or resistance on the chart? Why does it accelerate rapidly but then pause again at a seemingly random level? Standard technical analysis, based on price alone, often cannot answer these questions cleanly.
Volume Profile can. It shows not just where price has traded, but how much trading activity occurred at each price level.
By the end of this chapter, you will be able to:
- Interpret a Volume Profile and identify the Point of Control, High Volume Nodes, and Low Volume Nodes.
- Use these zones to set price targets and anticipate areas of resistance or acceleration.
- Combine Volume Profile with price structure to identify higher-quality swing trade zones.
The Key Components
Component | Definition | Trading Implication |
|---|---|---|
Point of Control (POC) | The price level with the highest trading volume over the period | Acts as a price magnet; price tends to return to POC after trending moves |
High Volume Node (HVN) | A price range where significant two-sided trading occurred | Price slows down here; expect congestion and potential reversals |
Low Volume Node (LVN) | A price range where very little trading occurred | Price moves quickly through here; LVNs are targets and transition zones |
Where the market has transacted heavily, it moves slowly. Where it has transacted little, it moves fast.
Think of a busy railway junction during peak hours versus an empty station at midnight. Nifty 50 moves through Low Volume Nodes quickly — those are your targets. It slows and struggles through High Volume Nodes — those are your resistance zones.
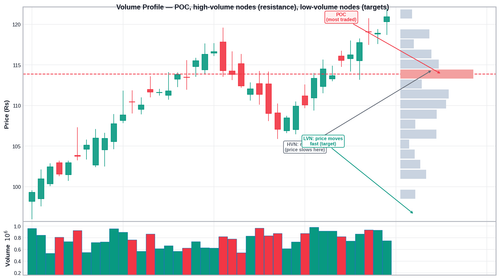
Applied to a stock setup with current price at ₹500:
Zone | Price Level | Type | What to Expect |
|---|---|---|---|
POC | ₹500 | Point of Control | Highest activity; price magnet on pullbacks |
HVN 1 | ₹488 to ₹495 | High Volume Node | Price will slow and consolidate when in this range |
LVN 1 | ₹506 to ₹518 | Low Volume Node | If price breaks ₹495, it will accelerate quickly to ₹518 |
HVN 2 | ₹518 to ₹530 | High Volume Node | Resistance zone; price likely to pause here on upward move |
Common Mistakes
Mistake 1: Using Volume Profile in isolation without price structure context
Volume Profile shows where activity has occurred. It does not show direction. Always combine with price structure analysis.
Mistake 2: Setting targets at HVNs without accounting for approach direction
An HVN acts differently depending on whether the price is approaching from below or above. From below, it is resistance. From above, it is support.
Key Takeaways
- The Point of Control is the highest-volume price level and acts as a price magnet. High Volume Nodes slow price. Low Volume Nodes accelerate it.
- Use LVNs as price targets after breakouts. Use HVNs to anticipate where a trending move will pause.
- Volume Profile adds precision to zone identification when combined with price structure.
Assignment
If your trading platform supports Volume Profile, apply a 3-month Volume Profile to the Nifty 50 chart. Identify the POC, the two nearest HVNs above current price, and any LVNs between them. Note these levels in your trade plan. Next time Nifty is near one of these levels, observe how price behaves — does it accelerate or stall?
In the next chapter, we combine price action, indicators, and Volume Profile into a single layered confirmation system — so you can evaluate the conviction of any swing setup using all three lenses together.
Disclaimer: This article is for informational purposes only and does not constitute financial advice. It is not produced by the desk of the Kotak Neo Research Team, nor is it a report published by the Kotak Neo Research Team. The information presented is compiled from several secondary sources available on the internet and may change over time. Investors should conduct their own research and consult with financial professionals before making any investment decisions. Read the full disclaimer here.
Investments in securities market are subject to market risks, read all the related documents carefully before investing. Brokerage will not exceed SEBI prescribed limit. The securities are quoted as an example and not as a recommendation. SEBI Registration No-INZ000200137 Member Id NSE-08081; BSE-673; MSE-1024, MCX-56285, NCDEX-1262.
Recommended Courses for you



















Learn, Invest, and Grow with Kotak Videos
Explore our comprehensive video library that blends expert market insights with Kotak's innovative financial solutions to support your goals.

Trading with collateral as margin with Kotak Neo

How India is Redefining Space Exploration

