

Kotak
Stockshaala
Chapter 3 | 2 min read
RSI Momentum Breakout Swing Strategy
In the previous chapter, we explored the EMA + ADX Trend Strength approach. Many experienced swing traders use multiple strategies depending on market conditions. In this chapter, we look at another commonly used approach: the RSI Momentum Breakout Strategy.
Most traders use RSI to find oversold conditions. As a standard reference, RSI below 30 is considered oversold, above 70 overbought, and the 50 level separates bullish from bearish momentum.
In a trending market, this approach consistently puts them against the dominant direction and misses the best part of every move. This strategy uses RSI differently: to confirm momentum is behind a breakout.
Strategy at a Glance
Element | Detail |
|---|---|
Tools | RSI (14) with 60/40 zones + price breakout level on daily chart |
Best condition | Momentum expansion after consolidation |
What RSI does here | Confirms trend strength — RSI above 60 = bullish momentum. This is not an overbought/oversold reading. |
Entry rule | Breakout candle closes above range high AND RSI is above 60 and rising on that candle |
Stop loss | Inside the breakout range: below the consolidation low for longs |
Exit rule | RSI drops below 50 OR price closes back inside the breakout range |
The Setup Logic
RSI sustaining above 60 during and after a breakout means momentum is confirming the price move. The combination of a price breakout above structure and RSI holding above 60 provides dual confirmation.
A Worked Example
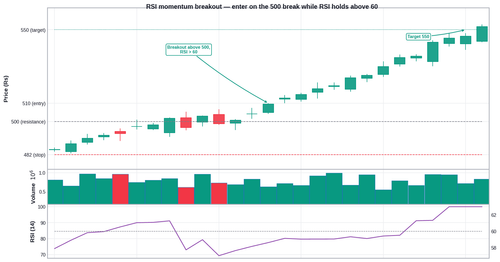
Breakout from consolidation near ₹500, account capital ₹5,00,000:
Event | Detail | Reading |
|---|---|---|
Consolidation range | ₹482 to ₹500 over 3 weeks | Range identified |
Breakout candle | Closes at ₹507, above range high ₹500 | Price breakout confirmed |
RSI on breakout candle | RSI at 64, rising from 54 | Above 60 and rising: momentum confirmed |
Entry | ₹510 (open of next session) | Enter |
Stop loss | ₹482 (below consolidation low) | Risk = ₹28 |
Position size | 178 shares | ₹5,000 / ₹28 (1% of ₹5,00,000) |
First target | ₹550 (prior swing high) | R-R approx. 1.4R |
Exit trigger | RSI drops below 50 OR price closes back below ₹500 | Whichever occurs first |
Common Mistakes
Mistake 1: Exiting because RSI approaches 70, treating it as overbought
In this strategy, RSI above 70 means the move is extremely strong. The exit trigger is RSI falling below 50, not RSI reaching 70.
Mistake 2: Entering a breakout where RSI is below 60 and declining
If RSI is below 60 on the breakout candle, the momentum confirmation is absent.
Key Takeaways
- RSI above 60 during a breakout confirms that momentum is behind the price move. This strategy uses RSI as a momentum gauge, not a mean-reversion signal.
- Stop loss goes inside the breakout range. The breakout base is what the thesis depends on.
- Exit when RSI drops below 50 or price closes back inside the range.
Assignment
On the Nifty 50 daily chart with RSI (14): find the last five breakouts from consolidation ranges. For each one, check what RSI was on the breakout candle — was it above 60 and rising?
Compare the performance of breakouts where RSI was above 60 versus those where it was below. Record your findings.
In the next chapter, we return to MACD — but this time as a standalone trading strategy using histogram acceleration to time trend entries.
Disclaimer: This article is for informational purposes only and does not constitute financial advice. It is not produced by the desk of the Kotak Neo Research Team, nor is it a report published by the Kotak Neo Research Team. The information presented is compiled from several secondary sources available on the internet and may change over time. Investors should conduct their own research and consult with financial professionals before making any investment decisions. Read the full disclaimer here.
Investments in securities market are subject to market risks, read all the related documents carefully before investing. Brokerage will not exceed SEBI prescribed limit. The securities are quoted as an example and not as a recommendation. SEBI Registration No-INZ000200137 Member Id NSE-08081; BSE-673; MSE-1024, MCX-56285, NCDEX-1262.
Recommended Courses for you



















Learn, Invest, and Grow with Kotak Videos
Explore our comprehensive video library that blends expert market insights with Kotak's innovative financial solutions to support your goals.

Trading with collateral as margin with Kotak Neo

How India is Redefining Space Exploration

