

Kotak
Stockshaala
Chapter 3 | 3 min read
Bollinger Bands: Volatility, Breakouts and Reversals
Most indicators measure price direction or momentum. Bollinger Bands measure something different: volatility. They answer the question that other indicators cannot: is the market currently compressed and likely to expand, or is it extended and likely to contract?
That single piece of information changes how every setup on the chart should be interpreted. A breakout in a compressed market is a high-quality signal. A breakout after extended expansion is a lower-quality one.
By the end of this chapter, you will be able to:
- Interpret Bollinger Bands (20,2) to assess the current volatility state of any stock.
- Identify the Bollinger Squeeze as a setup condition preceding breakouts.
- Recognise price walking the band as a trend strength signal.
How Bollinger Bands Work
Bollinger Bands consist of three lines: a 20-period Simple Moving Average (the middle band) and upper and lower bands set at two standard deviations from the middle band. The bands expand when volatility is high and contract when volatility is low.
Band State | What It Means | What to Expect |
|---|---|---|
Bands wide (expanded) | High volatility; large recent moves | Volatility may revert; extension setups are risky |
Bands narrow (squeezed) | Low volatility; market coiling | Expansion is coming; watch for breakout direction |
Price walks upper band | Strong uptrend; buyers consistently in control | Trend continuation; pullbacks to middle band are entry opportunities |
Price walks lower band | Strong downtrend; sellers in control | Trend continuation downward |
When the bands contract to their narrowest point in several months, this is the Bollinger Squeeze. It indicates that the market has been in a low-volatility consolidation phase and that a significant directional move is building. The squeeze does not tell you which direction the breakout will occur. Volume and price action confirm the direction.
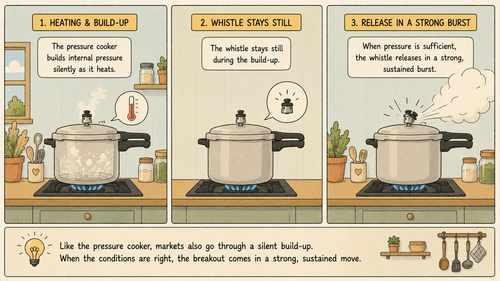
A pressure cooker builds internal pressure silently as it heats. The whistle stays still during the build-up. When pressure is sufficient, the whistle releases in a strong, sustained burst. A Bollinger Squeeze is that pressure build-up. The breakout candle is the whistle going off.
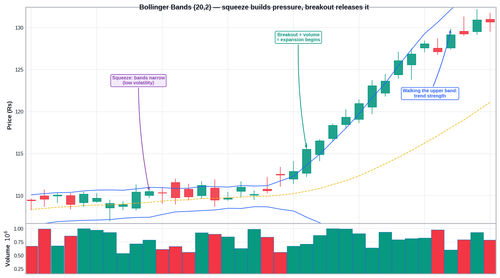
How the Bollinger Squeeze develops into a trade starting around a stock trading at ₹500:
Phase | Band Width | Price | Reading |
|---|---|---|---|
Normal trend | Wide bands | ₹482 to ₹518 range | Normal volatility |
Compression begins | Bands narrowing | ₹494 to ₹500 tight range | Volatility contracting |
Squeeze confirmed | Narrowest in 3 months | ₹497 to ₹499 daily range | Breakout imminent |
Breakout session | Bands begin expanding | Close at ₹505 on 2.2x volume | Upper band expanding; direction confirmed upward |
Entry | Bands expanding upward | ₹505 entry on close | Trend re-established; ride the expansion |
Common Mistakes
Mistake 1: Treating price touching the upper band as an immediate sell signal
Price running along the upper band in a strong uptrend is a sign of trend strength, not overbought conditions. Selling into a band touch in a strong trend means selling the strongest part of the move.
Mistake 2: Entering a squeeze breakout without volume confirmation
The squeeze indicates a breakout is coming. Volume on the breakout candle determines whether it is genuine. A squeeze breakout on below-average volume is high false-breakout risk.
Key Takeaways
- Bollinger Bands (20,2) measure volatility through band width. Narrow bands signal low volatility and a probable breakout. Wide bands signal extended volatility.
- Price walking the upper band is a strength signal, not an overbought signal. The middle band is the mean reversion target during pullbacks.
- A Bollinger Squeeze identifies the setup condition. Volume and direction confirm the breakout. Trade the breakout, not the squeeze itself.
Assignment
Add Bollinger Bands (20,2) to the Nifty 50 daily chart. Go back six months and find every period where the bands were noticeably narrower than their recent average (a Bollinger Squeeze).
For each squeeze you find:
(1) In which direction did price break out?
(2) Was volume above average on the breakout candle?
(3) How far did price move after the breakout?
Track these observations in a table.
_We have now covered the core indicators for swing trading. In the next module, we step back to ask whether fundamental analysis has any role in a swing trader's process — and how to use it as a quick filter without overcomplicating things. (The specific Bollinger Bands setups are covered later, in the Strategy Playbook.) _
Prefer watching over reading? We also have a video course covering this topic in full detail. Check it out here →
Disclaimer: This article is for informational purposes only and does not constitute financial advice. It is not produced by the desk of the Kotak Neo Research Team, nor is it a report published by the Kotak Neo Research Team. The information presented is compiled from several secondary sources available on the internet and may change over time. Investors should conduct their own research and consult with financial professionals before making any investment decisions. Read the full disclaimer here.
Investments in securities market are subject to market risks, read all the related documents carefully before investing. Brokerage will not exceed SEBI prescribed limit. The securities are quoted as an example and not as a recommendation. SEBI Registration No-INZ000200137 Member Id NSE-08081; BSE-673; MSE-1024, MCX-56285, NCDEX-1262.
Recommended Courses for you



















Learn, Invest, and Grow with Kotak Videos
Explore our comprehensive video library that blends expert market insights with Kotak's innovative financial solutions to support your goals.

Trading with collateral as margin with Kotak Neo

How India is Redefining Space Exploration

