

Kotak
Stockshaala
Chapter 1 | 3 min read
The Supertrend Indicator
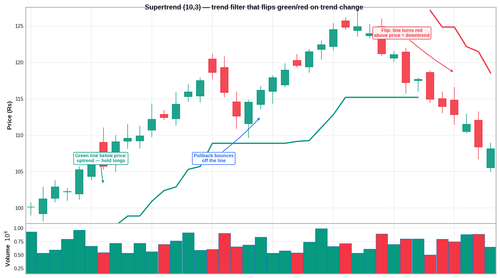
A trader who has been studying indicators for months sits down with a clean chart and adds the Supertrend. For the first time, the trend is not a matter of interpretation. There is a line. It is either below price (green, uptrend) or above price (red, downtrend). No ambiguity.
The Supertrend is one of the most visually clear trend filters available. But its simplicity is also its main risk: it invites over-reliance. Understanding what it calculates, where it works well, and where it does not is what separates traders who use it intelligently from those who use it blindly.
By the end of this chapter, you will be able to:
- Explain how the Supertrend indicator is calculated and what its settings mean.
- Use the Supertrend as a trend confirmation tool rather than a standalone entry signal.
- Identify the market conditions where the Supertrend performs well and where it fails.
How the Supertrend Works
The Supertrend is calculated using two inputs: a period and a multiplier.
The period (typically 10 sessions) controls how many candles are used to calculate the Average True Range.
The multiplier (typically 3) controls how far from price the bands are set. A higher multiplier produces wider bands — the line moves further from price — meaning fewer flips but more lag. A lower multiplier makes the line more sensitive and creates more signals. The standard setting for daily swing charts is (10,3).
When price closes below the lower band, the indicator flips red (downtrend). When price closes above the upper band, it flips green (uptrend). The Supertrend trails along as the trend progresses, creating a dynamic trailing stop reference.
Think of it like a ship's compass. A navigator does not use the compass to decide whether to sail. They use it to confirm the vessel is still pointed in the intended direction. The Supertrend is that compass. Entry decisions are made using price action and zone analysis. The Supertrend validates that the trend is still intact.
Session | Price (Rs.) | Supertrend | Signal | Action |
|---|---|---|---|---|
Day 1 | ₹500 | ₹482 (green) | Trend up; ST well below price | Monitor for pullback |
Day 5 | ₹488 | ₹484 (green) | Pullback to near Supertrend | Watch for rejection candle |
Day 6 | ₹496 | ₹485 (green) | Rejection candle, still above ST | Entry on break of Day 6 high |
Day 14 | ₹534 | ₹512 (green) | Strong advance; trail with ST | Trail stop at ₹512 |
Day 18 | ₹508 | ₹516 (flips red) | Close below ST; trend change | Exit full position |
Common Mistakes
Mistake 1: Using Supertrend as a standalone entry signal
A Supertrend flip does not generate a trade. It signals a change in trend regime. Entry still requires a price action trigger at a meaningful zone.
Mistake 2: Using Supertrend in sideways markets
The Supertrend flips repeatedly in sideways conditions, generating false signals in both directions. Verify on the weekly chart that the stock is trending before applying Supertrend on the daily.
Key Takeaways
- The Supertrend (10,3) plots a dynamic line below price in an uptrend (green) and above price in a downtrend (red). It flips when a daily close crosses the band.
- Use it as a trend confirmation filter, not a standalone entry signal.
- Supertrend works best in clearly trending markets. In sideways conditions, it produces unreliable signals.
Assignment
Add Supertrend (10,3) to the Nifty 50 daily chart. Go back three months. Count how many times the Supertrend flipped. For each flip, note whether it led to a sustained move or quickly reversed. Also identify at least two pullbacks where price touched the Supertrend line and bounced — these are the continuation entries this strategy is built around. Record your findings.
Later in the Strategy Playbook, we build on this by stacking two Supertrend lines — a slow one to confirm the trend and a fast one to time entries within it — creating a more precise entry system.
Prefer watching over reading? We also have a video course covering this topic in full detail. Check it out here →
Disclaimer: This article is for informational purposes only and does not constitute financial advice. It is not produced by the desk of the Kotak Neo Research Team, nor is it a report published by the Kotak Neo Research Team. The information presented is compiled from several secondary sources available on the internet and may change over time. Investors should conduct their own research and consult with financial professionals before making any investment decisions. Read the full disclaimer here.
Investments in securities market are subject to market risks, read all the related documents carefully before investing. Brokerage will not exceed SEBI prescribed limit. The securities are quoted as an example and not as a recommendation. SEBI Registration No-INZ000200137 Member Id NSE-08081; BSE-673; MSE-1024, MCX-56285, NCDEX-1262.
Recommended Courses for you



















Learn, Invest, and Grow with Kotak Videos
Explore our comprehensive video library that blends expert market insights with Kotak's innovative financial solutions to support your goals.

Trading with collateral as margin with Kotak Neo

How India is Redefining Space Exploration

