

Kotak
Stockshaala
Chapter 2 | 3 min read
The MACD Indicator
The MACD is one of the most widely used indicators in the world. It is also one of the most widely misunderstood. Most traders look at the crossover of the MACD line and the signal line and take that as a buy or sell signal. Used this way, the MACD produces too many signals and lags too far behind price to be useful on its own.
Used correctly, the MACD is an information source: it tells you whether the trend is accelerating or decelerating, whether momentum is confirming or diverging from price.
By the end of this chapter, you will be able to:
- Identify the three components of the MACD (12,26,9) and explain what each measures.
- Use the MACD histogram for momentum assessment rather than as a crossover signal generator.
- Identify bullish and bearish divergence on the MACD and interpret what it signals.
The Three Components
The MACD uses three numbers — written as (12,26,9). The first number (12) is the short-term EMA period. The second (26) is the long-term EMA period. The third (9) is the signal line period — a smoothed average of the MACD line itself. When the 12-period EMA is above the 26-period EMA, the MACD line is positive: short-term momentum is stronger than the long-term trend.
Component | What It Is | What It Tells You |
|---|---|---|
MACD Line | 12-period EMA minus 26-period EMA | Whether short-term momentum is above or below longer-term momentum |
Signal Line | 9-period EMA of the MACD Line | A smoothed version of the MACD; crossovers signal momentum shifts |
Histogram | MACD Line minus Signal Line | Show momentum acceleration. Growing bars = accelerating, Shrinking bars = decelerating |
Divergence occurs when price and the MACD histogram move in opposite directions. Bullish divergence: price makes a lower low but the histogram makes a higher low. Bearish divergence: price makes a higher high but the histogram makes a lower high. Divergence is an alert, not a trade entry signal.
Think of the MACD histogram as the speedometer on a vehicle. The direction of travel is the trend. But whether the vehicle is accelerating, maintaining speed, or slowing down is the histogram. Growing bars mean the market is pressing the accelerator. Shrinking bars mean it is easing off. When the bars cross into negative territory, the brakes are being applied.
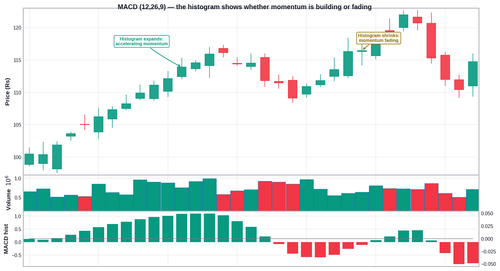
How the MACD histogram reads through a full Nifty 50 cycle starting from ₹380:
Phase | MACD Histogram | Price Action | Interpretation |
|---|---|---|---|
Accumulation | Small negative bars, flattening | Price sideways near ₹380 | Momentum decelerating on downside |
Zero-line crossover | Histogram turns positive (+0.8) | Price breaks ₹420 | Early bullish momentum; watch for expansion |
Expansion | Histogram grows: +1.4, +2.1, +3.2 | Price advances to ₹470 | Accelerating momentum: high conviction |
Maturity | Histogram shrinks: +2.4, +1.8, +0.9 | Price at ₹500, making new high | Bearish divergence warning: momentum fading |
Exit alert | Histogram negative, price lower low | Price drops to ₹482 | Momentum reversed: exit or tighten stop |
Common Mistakes
Mistake 1: Trading every MACD crossover as an entry signal
The MACD line crossing the signal line generates many false signals, especially in sideways markets. Use histogram expansion and zero-line context as the primary indicators.
Mistake 2: Treating divergence as an immediate entry signal
Divergence signals that momentum is weakening. It does not tell you when the price will reverse. Always wait for a price action confirmation trigger.
Key Takeaways
- The MACD (12,26,9) has three components: the MACD line (momentum direction), the signal line (smoothed momentum), and the histogram (momentum acceleration).
- Growing histogram bars above zero signal accelerating bullish momentum. Shrinking bars signal decelerating momentum.
- Divergence between price and histogram is an early warning of momentum exhaustion. It requires price action confirmation before any entry.
Assignment
Add MACD (12,26,9) to the Nifty 50 daily chart. Find the last strong trending move on the index. Answer:
(1) At what price level did the histogram first cross above zero?
(2) How many sessions did the expansion phase last?
(3) At what price did histogram contraction begin?
(4) Was there a bearish divergence near the top? Record these points and note how the price behaved after each.
In the next chapter, we introduce Bollinger Bands — an indicator that measures volatility itself, telling you whether the market is coiling for a breakout or already extended beyond its natural range. (We return to MACD as a full trading strategy later, in the Strategy Playbook.)
Prefer watching over reading? We also have a video course covering this topic in full detail. Check it out here →
Disclaimer: This article is for informational purposes only and does not constitute financial advice. It is not produced by the desk of the Kotak Neo Research Team, nor is it a report published by the Kotak Neo Research Team. The information presented is compiled from several secondary sources available on the internet and may change over time. Investors should conduct their own research and consult with financial professionals before making any investment decisions. Read the full disclaimer here.
Investments in securities market are subject to market risks, read all the related documents carefully before investing. Brokerage will not exceed SEBI prescribed limit. The securities are quoted as an example and not as a recommendation. SEBI Registration No-INZ000200137 Member Id NSE-08081; BSE-673; MSE-1024, MCX-56285, NCDEX-1262.
Recommended Courses for you



















Learn, Invest, and Grow with Kotak Videos
Explore our comprehensive video library that blends expert market insights with Kotak's innovative financial solutions to support your goals.

Trading with collateral as margin with Kotak Neo

How India is Redefining Space Exploration

