

Kotak
Stockshaala
Chapter 1 | 3 min read
Finding Swing Zones
A setup without a zone is a guess. Every swing trade entry needs to be anchored to a meaningful price level: a place where buying or selling has shown up consistently in the past, and where there is reason to expect it to show up again.
Without this anchor, entries feel random, stops are placed arbitrarily, and risk-reward calculations are based on hope rather than structure.
By the end of this chapter, you will be able to:
- Identify the three primary sources of swing zones: prior swing highs and lows, demand and supply zones, and key moving averages.
- Mark meaningful levels on a daily chart before beginning any setup analysis.
- Distinguish between strong zones with multiple touchpoints and weak zones unlikely to hold.
Three Sources of Swing Zones:
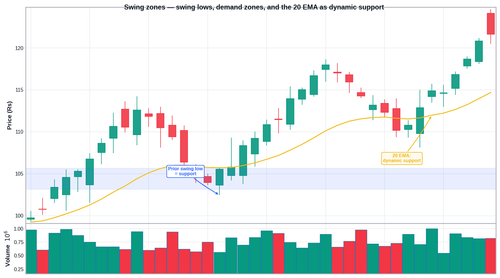
Swing highs and lows: The clearest zones on any chart are prior swing highs and lows — the levels where price previously reversed. A prior swing high that held twice becomes resistance. A prior swing low that held twice becomes support. The more times a level has been tested and respected, the more likely it is to matter again.
Demand and supply zones: These are areas where aggressive institutional activity caused a sharp, sustained move. Demand zones are identified by a cluster of candles followed by a strong breakout candle upward. These zones carry weight long after they form because institutions tend to return to the same price levels.
Key moving averages: Specifically the 20 EMA, 50 EMA, and 200 EMA — act as dynamic swing zones in trending markets. In a strong uptrend, the 20 EMA frequently provides the first line of support during pullbacks.

Think of a popular dosa stall in a busy market. The stall owner sets up at the same corner every day. Regular customers know exactly where to find them. New customers quickly learn the spot. Price returning to a level where significant activity occurred attracts the same participants for the same reason: the level is remembered because the trades that happened there are remembered.
Zone Type | Level (Rs.) | Basis | Strength |
|---|---|---|---|
Prior swing low | ₹482 | Tested and held 3 times in past 6 months | Strong |
Demand zone | ₹488 to ₹495 | Sharp upward move originated here 2 months ago | Strong |
50 EMA (dynamic) | ₹500 currently | Trending upward, price pulling back toward it | Moderate |
Prior swing high | ₹530 | Resistance that capped price twice previously | Strong |
Common Mistakes
Mistake 1: Drawing too many zones and treating every horizontal line as significant
A chart cluttered with lines is useless. Two or three most significant levels are usually sufficient. A zone is meaningful only if price has clearly responded to it at least twice.
Mistake 2: Ignoring zone quality in favour of recency
A zone that formed two years ago but has been tested and held multiple times is stronger than one that formed last week with only one touch.
Key Takeaways
- Swing zones come from three sources: prior swing highs and lows, demand and supply zones, and key moving averages.
- Mark the two or three most significant zones on the daily chart before evaluating any setup. Entry without a zone anchor is entry without a rationale for stop placement.
- Zone strength is determined by the number of times price has clearly responded at that level.
Assignment
Open the Nifty 50 daily chart. Draw horizontal lines at every level where price has clearly reversed at least twice in the last six months. You should find three to five meaningful zones.
Now mark each one with the zone type:
- Prior swing high/low,
- Demand/supply zone,
- EMA level.
Note where current price is relative to the nearest zone above and below. This is your structural map for the index.
In the next chapter, we cover the two entry types that work within these zones — breakouts and pullbacks — and why applying the wrong entry type to the right zone is still a losing trade.
Prefer watching over reading? We also have a video course covering this topic in full detail. Check it out here →
Disclaimer: This article is for informational purposes only and does not constitute financial advice. It is not produced by the desk of the Kotak Neo Research Team, nor is it a report published by the Kotak Neo Research Team. The information presented is compiled from several secondary sources available on the internet and may change over time. Investors should conduct their own research and consult with financial professionals before making any investment decisions. Read the full disclaimer here.
Investments in securities market are subject to market risks, read all the related documents carefully before investing. Brokerage will not exceed SEBI prescribed limit. The securities are quoted as an example and not as a recommendation. SEBI Registration No-INZ000200137 Member Id NSE-08081; BSE-673; MSE-1024, MCX-56285, NCDEX-1262.
Recommended Courses for you



















Learn, Invest, and Grow with Kotak Videos
Explore our comprehensive video library that blends expert market insights with Kotak's innovative financial solutions to support your goals.

Trading with collateral as margin with Kotak Neo

How India is Redefining Space Exploration

