

Kotak
Stockshaala
Chapter 1 | 3 min read
Understanding Market Structure
Two traders look at the same stock chart. One says it is in an uptrend. The other says it is just bouncing. Both are looking at the same data. The disagreement is not about the chart. It is about whether either trader has a clear, objective definition of what a trend actually is.
Without a precise definition of market structure, trend analysis becomes opinion. Every trader sees what they want to see, enters where they feel comfortable, and exits where fear or greed takes over. Structure replaces all of that with an objective framework that works on any chart, at any timeframe, without ambiguity.
By the end of this chapter, you will be able to:
- Define uptrends, downtrends, and sideways markets using the precise language of swing highs and swing lows.
- Mark structure levels on a daily chart before identifying any setup.
- Identify when a trend is intact versus when it has shown early signs of breaking down.
What Market Structure Actually Is:
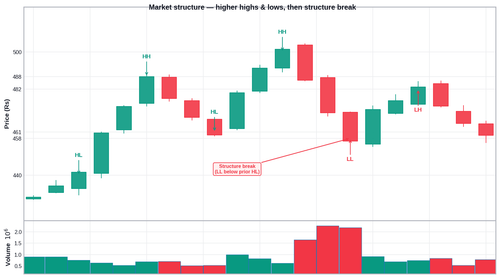
Markets do not move in straight lines. They advance, pause, retrace slightly, then advance again. Each pause creates a swing low. Each peak before a pullback creates a swing high. An uptrend, precisely defined, is a sequence of higher swing highs and higher swing lows. A downtrend is the opposite. Anything else is sideways.
Structure breaks happen before price confirms them. When an uptrend makes a lower swing low for the first time, the trend has not ended — but it has issued a warning. Watch whether the subsequent swing high also fails. Two consecutive structural failures signal a genuine change in trend.

Think of a building under construction. Builder adds floor after floor — each new floor higher than the last. That's an uptrend. But if the next floor never goes above the previous one's height, the builder knows something's wrong — momentum's dead.
Each floor = swing high. Each break between floors (before the next one starts) = swing low.
Swing Point | Price (Rs.) | Type | Trend Reading |
|---|---|---|---|
Swing Low 1 | ₹440 | Higher Low | Base established |
Swing High 1 | ₹488 | Higher High | Uptrend begins |
Swing Low 2 | ₹461 | Higher Low (above SL1) | Uptrend intact |
Swing High 2 | ₹500 | Higher High (above SH1) | Uptrend confirmed |
Swing Low 3 | ₹458 | Lower Low (below SL2) | First warning sign |
Swing High 3 | ₹482 | Lower High (below SH2) | Structure break confirmed |
Common Mistakes
Mistake 1: Calling a trend based on a single swing point
One higher high does not confirm an uptrend. One lower low does not end one. Structure requires at least two consecutive data points in sequence before a directional bias is valid.
Mistake 2: Confusing a short-term structure break with a major trend reversal
A lower low on a daily chart may simply be a correction within a weekly uptrend. Always check structure on the higher timeframe first.
Key Takeaways
- An uptrend is defined by higher swing highs and higher swing lows. A downtrend is defined by lower swing highs and lower swing lows. Any other pattern is sideways.
- Mark swing highs and lows on the daily chart before evaluating any entry setup. Structure gives you the context; the setup gives you the timing.
- A single lower low in an uptrend is a warning. A lower low followed by a lower high is a confirmed structure break. Treat these two situations differently.
Assignment
Open the Nifty 50 daily chart on your broker platform or TradingView. Going back 3 months, identify and mark every swing high and swing low. Classify each as Higher High, Higher Low, Lower High, or Lower Low.
Then answer: Is Nifty currently in an uptrend, downtrend, or sideways phase? Has there been a structure break in the last 30 days? Repeat this for one mid-cap stock of your choice.
Now that you can read trend structure objectively, the next chapter shows you which timeframes to use and how to stack them so the weekly, daily, and intraday charts all tell the same story before you enter a trade.
Disclaimer: This article is for informational purposes only and does not constitute financial advice. It is not produced by the desk of the Kotak Neo Research Team, nor is it a report published by the Kotak Neo Research Team. The information presented is compiled from several secondary sources available on the internet and may change over time. Investors should conduct their own research and consult with financial professionals before making any investment decisions. Read the full disclaimer here.
Investments in securities market are subject to market risks, read all the related documents carefully before investing. Brokerage will not exceed SEBI prescribed limit. The securities are quoted as an example and not as a recommendation. SEBI Registration No-INZ000200137 Member Id NSE-08081; BSE-673; MSE-1024, MCX-56285, NCDEX-1262.
Recommended Courses for you



















Learn, Invest, and Grow with Kotak Videos
Explore our comprehensive video library that blends expert market insights with Kotak's innovative financial solutions to support your goals.

Trading with collateral as margin with Kotak Neo

How India is Redefining Space Exploration

