

Kotak
Stockshaala
Chapter 4 | 2 min read
MACD Trend Acceleration Swing Strategy
In the previous chapter, we explored the RSI Momentum Breakout approach. Many experienced swing traders use multiple strategies depending on market conditions. In this chapter, we look at another commonly used approach: the MACD Trend Acceleration Strategy.
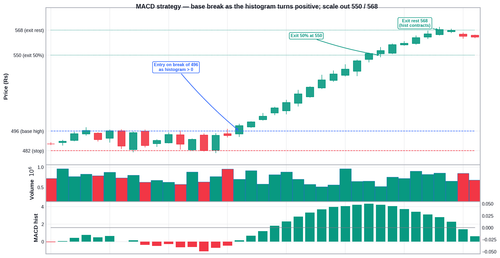
A stock finishes a three-week consolidation base. The MACD histogram has just crossed above zero. It has expanded for two consecutive sessions. Price has broken above the base high on the same day as the second expanding bar. That simultaneous event is the entry. (Refer back to Chapter 21 for a recap of how the MACD histogram works.)
Strategy at a Glance
Element | Detail |
|---|---|
Tools | MACD (12,26,9) histogram + zero-line context on daily chart |
Best condition | Early trend acceleration phase after a base or consolidation period |
Entry rule | Histogram turns positive and expands for at least 2 consecutive candles. Price simultaneously breaks above the base or consolidation high. |
Stop loss | Below the base low or the most recent swing low |
Exit rule | Histogram contracts for 2 to 3 consecutive candles OR bearish divergence appears near a key resistance level |
The Setup Logic
A zero-line crossover alone is not sufficient. What distinguishes a genuine acceleration phase is histogram expansion for multiple consecutive sessions after the crossover.
The simultaneous break of the base high confirms that price structure is agreeing with the momentum reading.
A Worked Example
Setup from consolidation near ₹482, entry at ₹500, account capital ₹5,00,000:
Session | Price (Rs.) | Histogram | Action |
|---|---|---|---|
Base period | ₹482 to ₹496 range | Negative, flat | No trade: consolidating |
Zero crossover | ₹498 | +0.4 | First positive bar; watching |
Expansion 1 | ₹500 | +0.9 | Histogram growing; condition 1 met |
Expansion + base break | ₹505 | +1.6 | Breaks base high at ₹496; entry at ₹505 |
Stop loss | ₹482 | Below base | Risk = ₹23; position size = 217 shares |
First target | ₹550 | Histogram still growing | Exit 50% of position |
Histogram contracts 3 sessions | ₹568 | Shrinking bars | Exit remaining 50% |
Common Mistakes
Mistake 1: Entering on the zero-line crossover before expansion is confirmed
A single positive bar is a signal to watch. The expansion must be confirmed by at least two growing bars.
Mistake 2: Holding through histogram contraction hoping for a second expansion
When the histogram contracts for two to three sessions, the momentum phase is complete.
Key Takeaways
- Entry requires the histogram above zero and expanding for two or more candles, price breaking above the base high, and a confirmed weekly uptrend.
- Stop goes below the base low. The base is what the trade thesis depends on.
- Exit 50% at the first target. Exit the remainder when the histogram contracts for two to three candles.
Assignment
On the Nifty 50 daily chart with MACD (12,26,9): find the last time the histogram crossed above zero and expanded for two or more consecutive bars. Did price simultaneously break above a consolidation high?
Calculate the entry, stop, position size (₹5,000 / stop loss distance), and first target. Was this a valid MACD Trend Acceleration entry?
In the next chapter, we cover the Fibonacci Pullback strategy — a proportional entry system that tells you precisely where in a pullback to re-enter a trending move.
Prefer watching over reading? We also have a video course covering this topic in full detail. Check it out here →
Disclaimer: This article is for informational purposes only and does not constitute financial advice. It is not produced by the desk of the Kotak Neo Research Team, nor is it a report published by the Kotak Neo Research Team. The information presented is compiled from several secondary sources available on the internet and may change over time. Investors should conduct their own research and consult with financial professionals before making any investment decisions. Read the full disclaimer here.
Investments in securities market are subject to market risks, read all the related documents carefully before investing. Brokerage will not exceed SEBI prescribed limit. The securities are quoted as an example and not as a recommendation. SEBI Registration No-INZ000200137 Member Id NSE-08081; BSE-673; MSE-1024, MCX-56285, NCDEX-1262.
Recommended Courses for you



















Learn, Invest, and Grow with Kotak Videos
Explore our comprehensive video library that blends expert market insights with Kotak's innovative financial solutions to support your goals.

Trading with collateral as margin with Kotak Neo

How India is Redefining Space Exploration

