

Kotak
Stockshaala
Chapter 3 | 4 min read
Candlestick Patterns That Actually Work for Swing Traders
Most traders learn candlestick patterns before they learn anything else about technical analysis. They memorise names and shapes, then go looking for them on charts. The problem is that a pattern found in isolation — without a meaningful zone underneath it and without volume support — means almost nothing.
This chapter covers three patterns that consistently produce actionable signals when they appear in the right place.
By the end of this chapter, you will be able to:
- Identify engulfing candles, hammers, and indecision candles on a daily chart.
- Evaluate whether a pattern is meaningful based on its location relative to a swing zone.
- Use these patterns as confirmation signals within a setup, not as standalone triggers.
The Three Patterns
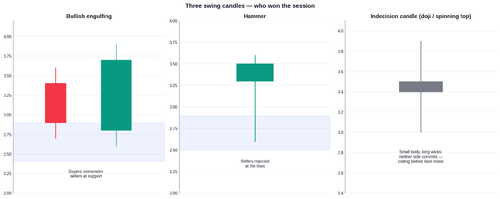
Bullish engulfing candle: This candle opens below the prior candle's close and closes above its open, completely engulfing the prior body. This shows that buyers overwhelmed sellers in a single session. At a support zone, this signals strong rejection.
Hammer candle: This has a small body near the top of the candle and a long lower wick. At support, it shows that sellers pushed price significantly lower during the session but buyers recovered nearly all of that loss by the close. The long lower wick is evidence of rejection. In Indian technical analysis this is commonly called a 'hammer' at support or a 'shooting star' at resistance — the position on the chart determines which it is.
Indecision candle (doji / spinning top): This is a candle whose daily range is significantly smaller than recent sessions. It signals that neither buyers nor sellers have conviction — the market is coiling. When it appears after a strong move and at a meaningful zone, it often precedes a continuation in the direction of the trend.
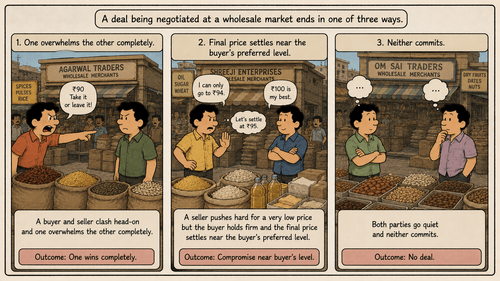
A deal being negotiated at a wholesale market ends in one of three ways. A buyer and seller clash head-on and one overwhelms the other completely: that is an engulfing candle. A seller pushes hard for a very low price but the buyer holds firm and the final price settles near the buyer's preferred level: that is a hammer. Both parties go quiet and neither commits: that is an indecision candle (doji / spinning top).
Pattern | What It Signals | Best Location | Entry Rule |
|---|---|---|---|
Bullish Engulfing | Buyers overwhelmed sellers in one session | At support zone or 20 EMA in uptrend | Enter on break of engulfing candle high |
Hammer | Sellers rejected at support; buyers took over | At key support, Fibonacci zone, or EMA | Enter on break of hammer high |
Indecision Candle (Doji / Spinning Top) | Consolidation after a move; tension building | After pullback in uptrend, at support | Enter on break of indecision candle high |
These three are the most actionable patterns for swing trading entries. For a comprehensive guide to all candlestick patterns and price action reading, see our dedicated Price Action course. Check out here →
Common Mistakes
Mistake 1: Acting on patterns in the middle of a range with no structural significance
A hammer in the middle of a price range, with no nearby support or resistance, is just a candle. Context is everything. The same pattern at a well-established support zone is a meaningful signal.
Mistake 2: Entering on the pattern candle itself instead of on confirmation
The pattern candle shows potential, not confirmation. Waiting for the next candle to break the pattern's high filters out the many patterns that form and then continue in the wrong direction.
Key Takeaways
- Engulfing candles, hammers, and indecision candles are the three most reliable candlestick confirmation signals for swing traders. They work only when they appear at meaningful structural zones.
- No candlestick pattern is a standalone entry signal. The zone creates the setup; the candle confirms the timing.
- Entry is on the break of the pattern candle's high for bullish setups, not on the pattern candle itself.
Assignment
Open the Nifty 50 daily chart and go back two months. Find one example each of a hammer, an engulfing candle, and an indecision candle that appeared at a meaningful support or resistance zone.
For each:
- Was price at a structural level?
- Did the next candle confirm?
- What happened in the sessions that followed?
Record your findings.
In the next chapter, we combine these patterns with trend and zone analysis into a single three-step rule that tells you precisely when all conditions are met and you are cleared to enter a trade.
Prefer watching over reading? We also have a video course covering this topic in full detail. Check it out here →
Disclaimer: This article is for informational purposes only and does not constitute financial advice. It is not produced by the desk of the Kotak Neo Research Team, nor is it a report published by the Kotak Neo Research Team. The information presented is compiled from several secondary sources available on the internet and may change over time. Investors should conduct their own research and consult with financial professionals before making any investment decisions. Read the full disclaimer here.
Investments in securities market are subject to market risks, read all the related documents carefully before investing. Brokerage will not exceed SEBI prescribed limit. The securities are quoted as an example and not as a recommendation. SEBI Registration No-INZ000200137 Member Id NSE-08081; BSE-673; MSE-1024, MCX-56285, NCDEX-1262.
Recommended Courses for you



















Learn, Invest, and Grow with Kotak Videos
Explore our comprehensive video library that blends expert market insights with Kotak's innovative financial solutions to support your goals.

Trading with collateral as margin with Kotak Neo

How India is Redefining Space Exploration

