

Kotak
Stockshaala
Chapter 1 | 2 min read
EMA Pullback Swing Strategy
We have now covered the fundamentals of swing trading across nine modules: from market structure and timeframes to indicators, volume, fundamentals, and the psychology of execution. It is now time to see it all in action.
This module presents multiple swing trading strategies. Each one has clear entry conditions, a stop loss rule, and an exit trigger. Many experienced swing traders use these approaches on Indian markets every day.
The EMA Pullback is the most fundamental swing trading strategy. It captures one thing only: trend continuation after a brief, healthy pause. Mastering it is enough to trade profitably for a career.
Strategy at a Glance
Element | Detail |
|---|---|
Tools | 20 EMA, 50 EMA on daily chart |
Best condition | Established uptrend with clear higher highs and higher lows |
Entry rule | Price pulls back to 20 EMA zone, hammer or engulfing candle forms, enter on break of rejection candle high |
Stop loss | Below most recent swing low (not below the EMA itself) |
First exit | Prior swing high |
Trail | With 20 EMA until daily close breaks below it |
The Setup Logic
Trends advance in waves. Each pullback to the 20 EMA represents the market's natural rhythm of advance and rest. The rejection candle at that zone is the evidence of buyers returning.
The 50 EMA sitting below confirms the broader trend structure is intact. A stock where the 20 EMA and 50 EMA are converging or crossing is in a deteriorating trend and does not qualify.
A Worked Example
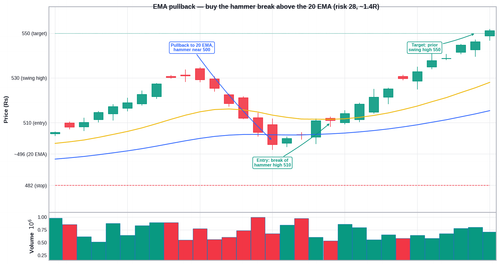
The following example uses entry price Rs. 500 and account capital Rs. 5,00,000.
Event | Price (Rs.) | What It Means |
|---|---|---|
Recent swing high | ₹530 | Uptrend established |
Pullback low near 20 EMA | ₹500 | 20 EMA at ₹496; 50 EMA at ₹482 |
Rejection candle closes | ₹507 | Hammer: low ₹494, close ₹507 |
Entry: break of candle high | ₹510 | Trend resumption confirmed |
Stop loss | ₹482 | Below recent swing low; risk = ₹28 per share |
Position size | 178 shares | ₹5,000 / ₹28 (1% of ₹5,00,000) |
First target | ₹550 | Prior swing high; risk-reward approx. 1.4R |
Common Mistakes
Mistake 1: Entering on price touching the 20 EMA without a rejection candle
The EMA is the zone of interest, not the entry trigger. Without a rejection candle and break of its high, there is no confirmation that buyers have stepped in.
Mistake 2: Stop loss placed below the 20 EMA line
The 20 EMA moves every session. A structural stop below the most recent swing low is fixed and logical.
Key Takeaways
- The 20 EMA marks the pullback zone. The 50 EMA confirms trend health. Both must be checked before any entry.
- Entry is on the break of the rejection candle's high. Never on the pullback itself.
- Stop below the most recent swing low. Exit partially at prior swing high. Trail the rest with the 20 EMA.
Assignment
Apply the 20 and 50 EMA to the Nifty 50 daily chart. Find the last three pullbacks to the 20 EMA zone. For each one: was a rejection candle present? What was the risk-reward if you had entered on the break of that candle's high with a stop at the structural swing low? Record your findings on the Nifty chart specifically.
In the next chapter, we look at the EMA + ADX Trend Strength strategy — which pairs a moving average with the ADX to confirm the trend is strong enough to trade before entering.
Prefer watching over reading? We also have a video course covering this topic in full detail. Check it out here →
Disclaimer: This article is for informational purposes only and does not constitute financial advice. It is not produced by the desk of the Kotak Neo Research Team, nor is it a report published by the Kotak Neo Research Team. The information presented is compiled from several secondary sources available on the internet and may change over time. Investors should conduct their own research and consult with financial professionals before making any investment decisions. Read the full disclaimer here.
Investments in securities market are subject to market risks, read all the related documents carefully before investing. Brokerage will not exceed SEBI prescribed limit. The securities are quoted as an example and not as a recommendation. SEBI Registration No-INZ000200137 Member Id NSE-08081; BSE-673; MSE-1024, MCX-56285, NCDEX-1262.
Recommended Courses for you



















Learn, Invest, and Grow with Kotak Videos
Explore our comprehensive video library that blends expert market insights with Kotak's innovative financial solutions to support your goals.

Trading with collateral as margin with Kotak Neo

How India is Redefining Space Exploration

