

Kotak
Stockshaala
Chapter 3 | 3 min read
Price Action + Indicators + Volume Profile: A Combined System
Using price action alone leaves gaps where the chart is ambiguous. Using indicators alone produces signals without structural context. Using Volume Profile alone shows activity without direction. Each tool, applied in isolation, has blind spots.
When all three are combined as a layered confirmation system, each tool's blind spot is covered by one of the others. This chapter shows you how to layer them in practice.
By the end of this chapter, you will be able to:
- Combine price structure, an EMA or Supertrend indicator, and Volume Profile into a unified setup framework.
- Identify when all three inputs are aligned and when one is missing or contradicting the others.
- Apply this combined framework to evaluate the conviction level of any swing setup.
The Three Layers
The price action layer: It provides the structural context. Is the stock in an uptrend? Is price pulling back to a meaningful zone? Is there a candlestick confirmation signal? Price action defines what the setup is and where the stop and target go. For a deeper dive into price action reading, check out our dedicated Price Action course on Kotak Stockshaala.
The indicator layer: This filters out setups where the trend is ambiguous. Using the 20 EMA and 50 EMA (or Supertrend), confirm that price is above the trend-confirming line. The indicator does not generate the entry. It validates that the underlying trend supports the price action setup.
The Volume Profile layer: This adds precision to both the entry zone and the target. If the price action setup is forming at a High Volume Node, the zone is higher quality. If the target sits above a Low Volume Node, the path to it has low resistance.

A senior doctor does not diagnose based on one test alone. The patient's description of symptoms is the price action: the story. The blood test results are the indicator: objective confirmation. The imaging scan is the Volume Profile: internal structure the other two cannot reveal. A confident treatment decision requires all three to agree.
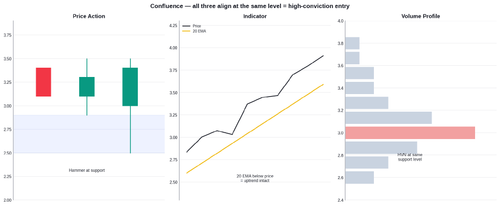
A stock pullback to the ₹500 zone — each layer checked in sequence:
Layer | Check | Reading | Status |
|---|---|---|---|
Price Action | Daily trend and zone | HH/HL uptrend, pullback to 20 EMA + prior support at ₹500 | Pass |
Price Action | Trigger candle | Hammer at ₹500 zone, next candle broke ₹512 | Pass |
Indicator | 20 EMA direction | 20 EMA rising, price above it throughout uptrend | Pass |
Indicator | Supertrend confirmation | Supertrend green, no flip during pullback | Pass |
Volume Profile | Zone quality | ₹496 to ₹504 is a HVN: historically active zone | Pass |
Volume Profile | Target path | LVN between ₹510 and ₹530; target set at ₹530 | Pass |
Common Mistakes
Mistake 1: Treating the three layers as equal in importance
Price action is the primary layer. Indicators and Volume Profile are confirmation tools. If price action is weak, no amount of indicator agreement makes the setup valid.
Mistake 2: Forcing all three layers to align when the chart is ambiguous
When the layers conflict or one is neutral, reduce position size or skip the trade. Not every chart offers clean three-layer alignment.
Key Takeaways
- The three-layer framework combines price action (setup and zone), an indicator (trend confirmation), and Volume Profile (zone quality and target precision).
- Price action is primary. Indicators and Volume Profile are confirmation tools.
- When one layer is neutral or missing, reduce position size to reflect the lower conviction.
Assignment
Apply the three-layer framework to the Nifty 50 right now.
(1) Price action: Is there a defined trend? Is price near a meaningful zone with a trigger candle?
(2) Indicator: Is price above the 20 EMA? Is Supertrend green?
(3) Volume Profile: Is the zone near a HVN? Is there a LVN between the zone and the target?
Write a one-paragraph trade thesis describing what all three layers say. Then decide: enter, wait, or skip?
In the next chapter, we cover Fibonacci retracement — a proportional tool that tells you exactly how deep a pullback should go before the trend is expected to resume.
Prefer watching over reading? We also have a video course covering this topic in full detail. Check it out here →
Disclaimer: This article is for informational purposes only and does not constitute financial advice. It is not produced by the desk of the Kotak Neo Research Team, nor is it a report published by the Kotak Neo Research Team. The information presented is compiled from several secondary sources available on the internet and may change over time. Investors should conduct their own research and consult with financial professionals before making any investment decisions. Read the full disclaimer here.
Investments in securities market are subject to market risks, read all the related documents carefully before investing. Brokerage will not exceed SEBI prescribed limit. The securities are quoted as an example and not as a recommendation. SEBI Registration No-INZ000200137 Member Id NSE-08081; BSE-673; MSE-1024, MCX-56285, NCDEX-1262.
Recommended Courses for you



















Learn, Invest, and Grow with Kotak Videos
Explore our comprehensive video library that blends expert market insights with Kotak's innovative financial solutions to support your goals.

Trading with collateral as margin with Kotak Neo

How India is Redefining Space Exploration

