

Kotak
Stockshaala
Chapter 7 | 3 min read
Ichimoku Swing Trend Strategy
In the previous chapter, we explored the RSI Reversal Swing approach. Many experienced swing traders use multiple strategies depending on market conditions. In this chapter, we look at another commonly used approach: the Ichimoku Swing Trend Strategy.
Before the strategy, a quick introduction to the Ichimoku Cloud system. Ichimoku Kinko Hyo is a Japanese charting technique that displays five lines and a shaded cloud region on the same chart.
For swing trading, two components matter most.
- The Cloud (Kumo): if price is above the cloud, the trend is bullish; below it, bearish; inside it, undefined.
- The Kijun-sen (Base Line): calculated as the midpoint of the highest high and lowest low over the past 26 sessions. In a trending market it acts like a moving average and provides the primary pullback support level. Standard settings are Tenkan 9, Kijun 26, Senkou B 52.
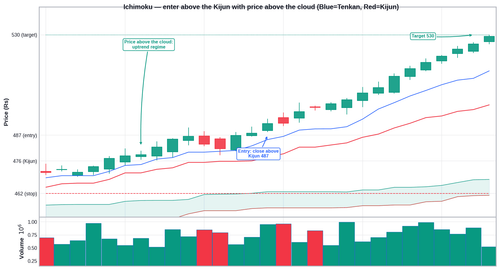
The chart shows the stock well above a shaded cloud zone. The Kijun-sen midline sits below current price. The index has pulled back cleanly to that midline over four sessions and stalled there. A small rejection candle is forming.
Strategy at a Glance
Element | Detail |
|---|---|
Tools | Ichimoku Cloud (Tenkan 9, Kijun 26, Senkou B 52) on daily chart |
Best condition | Clean directional swings where a trend regime filter is needed |
What the Cloud does | Acts as dynamic support/resistance. Price above cloud = bullish regime. Price below = bearish. |
What the Kijun-sen does | Acts as a medium-term baseline and dynamic support. Pullbacks to Kijun in an uptrend are the primary entry zone. |
Entry rule | Price is above cloud. Pullback holds the Kijun-sen. A bullish confirmation candle forms at or above the Kijun. Enter on break of that candle's high. |
Stop loss | Below the Kijun-sen or the most recent swing low, whichever is lower |
Exit rule | Close into the cloud from above OR two consecutive closes below the Kijun-sen |
The Setup Logic
The Cloud defines the trend regime. A bullish swing trade is only considered when price is clearly above the entire cloud. The Kijun-sen provides a dynamic mid-trend support level more stable than faster EMAs.
When price is above the cloud and pulls back to the Kijun-sen without breaking below it, the trend structure is intact and the pullback offers a high-quality entry.
A Worked Example
A stock with cloud upper boundary at ₹482, Kijun-sen at ₹496, current price ₹530 pulling back. Account capital ₹5,00,000:
Component | Reading | Implication |
|---|---|---|
Cloud (Kumo) | Cloud upper boundary at ₹482, lower at ₹470 | Bullish regime confirmed: price at ₹530 is above cloud |
Kijun-sen | ₹496 (26-session midpoint) | Primary pullback support zone |
Pullback to Kijun | Price pulls back to ₹498 over 4 sessions | Kijun-sen holds: no close below ₹496 |
Confirmation candle | Hammer at ₹498, close ₹504 | Rejection at Kijun: entry trigger formed |
Entry | ₹507 (break of hammer high) | Entered |
Stop loss | ₹482 (below Kijun and nearest swing low) | Risk = ₹25; position size = 200 shares |
First target | ₹550 (prior swing high) | R-R approx. 1.7R |
Common Mistakes
Mistake 1: Entering when price is inside the cloud rather than above it
The cloud represents a zone of indecision. When price is inside the cloud, the trend regime is undefined. Only trade this strategy when price is clearly above the entire cloud for longs.
Mistake 2: Exiting on a single close below the Kijun-sen
One close below the Kijun-sen may be a brief spike. The exit signal is two consecutive closes below the Kijun-sen or a close into the cloud.
Key Takeaways
- Price above the Ichimoku Cloud confirms a bullish regime. The Kijun-sen is the primary pullback support zone for entries within that regime.
- Entry requires the Kijun-sen to hold on a closing basis during the pullback, a confirmation candle, and entry on the break of that candle's high.
- Exit on two consecutive daily closes below the Kijun-sen or on a close into the cloud. One brief breach is not sufficient.
Assignment
Add the Ichimoku Cloud to the Nifty 50 daily chart. Check:
- Is price currently above the cloud, below it, or inside it?
- Where is the Kijun-sen relative to current price?
- If there has been a recent pullback, did price hold the Kijun-sen on a closing basis?
Calculate what the entry trigger, stop, and target would have been using the ₹5,00,000 account and 1% risk rule.
In the next strategy chapter, we layer two Supertrend lines — a slow line as a regime filter and a faster line to time entries — into the Dual Supertrend system.
Disclaimer: This article is for informational purposes only and does not constitute financial advice. It is not produced by the desk of the Kotak Neo Research Team, nor is it a report published by the Kotak Neo Research Team. The information presented is compiled from several secondary sources available on the internet and may change over time. Investors should conduct their own research and consult with financial professionals before making any investment decisions. Read the full disclaimer here.
Investments in securities market are subject to market risks, read all the related documents carefully before investing. Brokerage will not exceed SEBI prescribed limit. The securities are quoted as an example and not as a recommendation. SEBI Registration No-INZ000200137 Member Id NSE-08081; BSE-673; MSE-1024, MCX-56285, NCDEX-1262.
Recommended Courses for you



















Learn, Invest, and Grow with Kotak Videos
Explore our comprehensive video library that blends expert market insights with Kotak's innovative financial solutions to support your goals.

Trading with collateral as margin with Kotak Neo

How India is Redefining Space Exploration

