

Kotak
Stockshaala
Chapter 6 | 3 min read
RSI Reversal Swing Strategy
In the previous chapter, we explored the Fibonacci Pullback approach. Many experienced swing traders use multiple strategies depending on market conditions. In this chapter, we look at another commonly used approach: the RSI Reversal Swing Strategy.
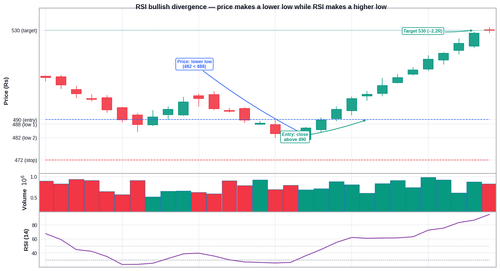
A stock declining for 6 weeks, hits a support level it has held twice before. Volume is lower than it was on the prior lows. RSI registers a lower price low — but the RSI reading itself is higher than it was on the first low. Price is weaker. Momentum is not. That divergence is the core signal.
Strategy at a Glance
Element | Detail |
|---|---|
Tools | RSI (14) + bullish divergence + horizontal support on daily chart |
Best condition | Range-bound market or a stretched swing move near a major support level |
Entry rule (long) | Bullish divergence visible: price makes a lower low but RSI makes a higher low. Price closes above the prior candle's high at or near support. |
Stop loss | Below the support zone where the divergence occurred |
Exit rule | Opposite boundary of the range OR RSI fails to push above 50 and hold after entry |
The Setup Logic
Bullish divergence occurs when price makes a lower low but the RSI makes a higher low. This tells you that selling pressure is weakening even as price tests a new low.
The divergence alone is not an entry signal. Price can continue lower even with divergence. The price action trigger — a close above the prior candle's high near a support zone — confirms that buyers have stepped in.
A Worked Example
A stock support near ₹482, account capital ₹5,00,000:
Event | Price (Rs.) | RSI | Reading |
|---|---|---|---|
First swing low | ₹488 | RSI at 31 | Price low, RSI low |
Recovery | ₹500 | RSI recovers to 48 | Partial bounce |
Second swing low | ₹482 | RSI at 38 | Price lower low, RSI HIGHER low — divergence confirmed |
Price action trigger | Close at ₹490 | Above prior candle high | Entry triggered |
Stop loss | ₹472 | Below support zone | Risk = ₹18; position size = 277 shares |
Target | ₹530 | Prior range high | R-R approx. 2.2R |
Common Mistakes
Mistake 1: Applying the RSI Reversal strategy in a strong trending market
In a strong downtrend, bullish divergence can appear multiple times without a genuine reversal. This strategy is designed for range-bound conditions or major support zones.
Mistake 2: Acting on divergence without waiting for the price action trigger
Divergence signals weakening momentum. The price close above the prior candle's high confirms buyers have stepped in.
Key Takeaways
- Bullish divergence (price lower low, RSI higher low) signals weakening selling pressure. It is an alert, not a trade. The price action trigger confirms entry.
- This strategy is designed for range-bound conditions or major support zones. It is not for use in strongly trending markets.
- Stop below the support zone. Target at the opposite range boundary. If RSI fails to push above 50 after entry, exit.
Assignment
On the Nifty 50 daily chart with RSI (14): look at the last significant range-bound period on the index. Find two swing lows in that range. Did price make a lower low whilst RSI made a higher low? Was there a support zone near the divergence? Calculate what the entry trigger, stop level, and first target would have been.
In the next strategy chapter, we cover the Ichimoku Swing Trend setup — a system that uses the cloud as a regime filter and the Kijun-sen as the primary pullback zone.
Prefer watching over reading? We also have a video course covering this topic in full detail. Check it out here →
Disclaimer: This article is for informational purposes only and does not constitute financial advice. It is not produced by the desk of the Kotak Neo Research Team, nor is it a report published by the Kotak Neo Research Team. The information presented is compiled from several secondary sources available on the internet and may change over time. Investors should conduct their own research and consult with financial professionals before making any investment decisions. Read the full disclaimer here.
Investments in securities market are subject to market risks, read all the related documents carefully before investing. Brokerage will not exceed SEBI prescribed limit. The securities are quoted as an example and not as a recommendation. SEBI Registration No-INZ000200137 Member Id NSE-08081; BSE-673; MSE-1024, MCX-56285, NCDEX-1262.
Recommended Courses for you



















Learn, Invest, and Grow with Kotak Videos
Explore our comprehensive video library that blends expert market insights with Kotak's innovative financial solutions to support your goals.

Trading with collateral as margin with Kotak Neo

How India is Redefining Space Exploration

