

Kotak
Stockshaala
Chapter 5 | 2 min read
Fibonacci Pullback Swing Strategy
In the previous chapter, we explored the MACD Trend Acceleration approach. Many experienced swing traders use multiple strategies depending on market conditions. In this chapter, we look at another commonly used approach: the Fibonacci Pullback Strategy.
A stock rallies sharply for five weeks. Then it pulls back. You want to re-enter but have no objective way to determine how deep the pullback should go. Too early and you catch a falling knife. Too late and the move has already gone. The Fibonacci Pullback Strategy solves this. (Refer back to Chapter 19 for a recap of how to draw Fibonacci retracement levels.)
Strategy at a Glance
Element | Detail |
|---|---|
Tools | Fibonacci retracement levels 38.2%, 50%, 61.8% drawn on daily chart |
Best condition | Trending markets with a controlled, orderly pullback after a clear impulse swing |
Entry rule | Pullback holds within the 38.2% to 61.8% zone. A rejection candle (hammer or engulfing) forms within that zone. Enter on break of rejection candle high. |
Stop loss | Below the 61.8% Fibonacci level or the prior swing low, whichever is lower |
First exit | Prior swing high (the swing from which the Fibonacci was drawn) |
Trail | With the 20 EMA or swing lows after first target hit |
The Setup Logic
After a strong impulse move, participants who missed the initial move wait for a pullback to re-enter at a more favourable price. This creates predictable retracement zones around the 38.2% to 61.8% range.
The rejection candle within the Fibonacci zone confirms that buyers have re-entered. Without a rejection candle, price arriving at a Fibonacci level is an observation, not an entry signal.
A Worked Example
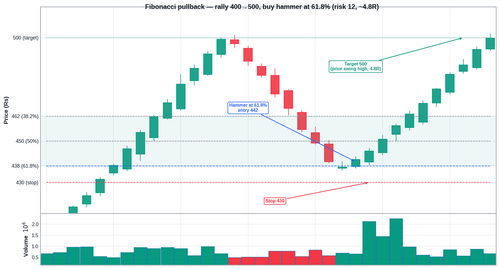
A stock rally from ₹400 to ₹500 (₹100 move). Fibonacci retracement applied. Account capital ₹5,00,000:
Fib Level | Price (Rs.) | Significance | Outcome |
|---|---|---|---|
38.2% | ₹462 | Upper edge of primary entry window | Price passes through on pullback |
50.0% | ₹450 | Midpoint: frequently strong support | Watch for rejection candle |
61.8% | ₹438 | Lower edge of primary entry window | Hammer candle forms here |
Entry | ₹442 | Break of hammer high | Entered |
Stop loss | ₹430 | Below 61.8% and swing low | Risk = ₹12; position size = 416 shares |
First target | ₹500 | Prior swing high | R-R approx. 4.8R |
Common Mistakes
Mistake 1: Entering purely because price reaches a Fibonacci level without a rejection candle
A Fibonacci level is a zone to monitor. The rejection candle is what confirms buyers have stepped in.
Mistake 2: Using an incorrectly drawn Fibonacci from minor swings
Draw from the most significant recent swing low to swing high. Drawing from minor swings produces irrelevant levels.
Key Takeaways
- Draw Fibonacci from the most recent significant swing low to swing high. The 38.2% to 61.8% zone is the primary entry window.
- Entry requires a rejection candle within the Fibonacci zone. Enter on the break of the rejection candle's high.
- Stop goes below the 61.8% level or the prior swing low. First target is the prior swing high.
Assignment
On the Nifty 50 daily chart: find the most recent rally of at least 5% followed by a controlled pullback. Draw the Fibonacci retracement from that swing low to swing high. Did the pullback pause at any of the three key levels — 38.2%, 50%, or 61.8%? Was there a rejection candle at any of those levels? Calculate what the entry, stop, position size, and first target would have been.
In the next chapter, we cover the RSI Reversal strategy — using RSI divergence to identify when a selling move has exhausted itself and a bounce is likely.
Disclaimer: This article is for informational purposes only and does not constitute financial advice. It is not produced by the desk of the Kotak Neo Research Team, nor is it a report published by the Kotak Neo Research Team. The information presented is compiled from several secondary sources available on the internet and may change over time. Investors should conduct their own research and consult with financial professionals before making any investment decisions. Read the full disclaimer here.
Investments in securities market are subject to market risks, read all the related documents carefully before investing. Brokerage will not exceed SEBI prescribed limit. The securities are quoted as an example and not as a recommendation. SEBI Registration No-INZ000200137 Member Id NSE-08081; BSE-673; MSE-1024, MCX-56285, NCDEX-1262.
Recommended Courses for you















Learn, Invest, and Grow with Kotak Videos
Explore our comprehensive video library that blends expert market insights with Kotak's innovative financial solutions to support your goals.

Trading with collateral as margin with Kotak Neo

How India is Redefining Space Exploration