

Kotak
Stockshaala
Chapter 3 | 3 min read
Reversal or Correction?
A stock you have been watching drops 7% over three sessions. Your first instinct is to check whether the uptrend is over. Your second instinct, if you are already in the trade, is to exit before it gets worse.
Both instincts are triggered by the same question: is this a reversal or just a correction? The answer determines whether the right response is to exit, hold, or even add.
By the end of this chapter, you will be able to:
- Distinguish between a correction within a trend and a genuine reversal using structure, volume, and momentum.
- Apply three specific checks before changing your directional bias on an existing trade.
- Avoid premature exits from valid trends and avoid holding through confirmed reversals.
Three Checks Before Changing Your Bias:
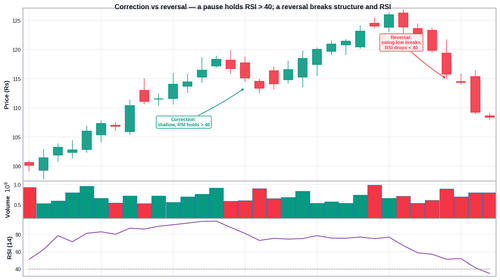
Structure: A correction stays within the existing structure. In an uptrend, a correction pulls back but does not create a lower swing low below the prior significant low. A reversal breaks structure: it creates that lower low and then follows with a lower high.
Volume: Corrections typically occur on declining or average volume. A reversal is characterised by high-volume selling. Expanding volume on the down candles is the tell.
Momentum: In a correction, RSI typically holds above 40 in an uptrend. In a reversal, RSI breaks below 40 and stays there.
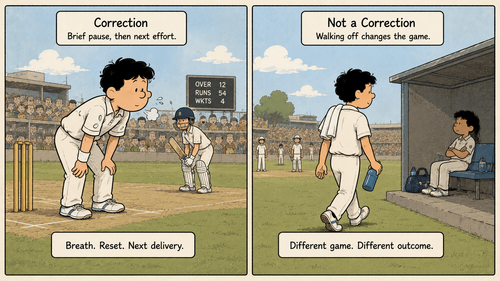
Think of a fast bowler who slows down between deliveries to catch his breath. That is a correction: a brief pause before the next effort. If the same bowler walks off the field and sits down, the game has changed. A swing trader watching a pullback needs to ask the same question: is the action pausing, or has it dropped off?
Check | Correction Reading | Reversal Reading | What Stock A Shows |
|---|---|---|---|
Structure | Pullback holds above prior swing low | New lower low formed | Holds above prior low at ₹462 |
Volume | Declining volume on down days | Expanding volume on down days | Volume drops 30% during pullback |
RSI | RSI holds above 40, recovers quickly | RSI breaks below 40 and stays | RSI at 44, recovering |
Verdict | Correction: trend intact | Reversal: bias changed | Correction: no change in bias |
Common Mistakes
Mistake 1: Treating any multi-day pullback as a reversal
Three red candles in a row feel alarming. But in a strong uptrend, multi-session pullbacks are normal. The question is not how many sessions are red, but whether structure, volume, and momentum readings have changed.
Mistake 2: Waiting for all three checks to confirm a reversal before acting
If structure breaks and volume expands strongly on the breakdown, that is enough evidence. You do not need to wait for RSI confirmation if the first two checks are decisive.
Key Takeaways
-
A correction stays within existing structure, occurs on declining volume, and sees momentum hold above key RSI levels. A reversal breaks structure, comes on expanding volume, and sees momentum fail to recover.
-
Check all three indicators before changing your directional bias. No single check alone is sufficient.
-
The default assumption in an established trend should be correction, not reversal. The burden of proof is on the evidence.
Assignment
Open the Nifty 50 daily chart. Find two distinct pullbacks from the last six months. For each one, apply the three checks:
- Did the pullback create a lower low?
- Did volume expand or contract during the decline?
- Did RSI drop below 40?
Based on your analysis, classify each as a correction or a reversal. Were you right? Compare your conclusion to what price did in the sessions that followed.
With market structure and timeframes covered, we now move into the core of swing trading: finding the specific price zones where setups form and entries have the highest structural backing.
Disclaimer: This article is for informational purposes only and does not constitute financial advice. It is not produced by the desk of the Kotak Neo Research Team, nor is it a report published by the Kotak Neo Research Team. The information presented is compiled from several secondary sources available on the internet and may change over time. Investors should conduct their own research and consult with financial professionals before making any investment decisions. Read the full disclaimer here.
Investments in securities market are subject to market risks, read all the related documents carefully before investing. Brokerage will not exceed SEBI prescribed limit. The securities are quoted as an example and not as a recommendation. SEBI Registration No-INZ000200137 Member Id NSE-08081; BSE-673; MSE-1024, MCX-56285, NCDEX-1262.
Recommended Courses for you



















Learn, Invest, and Grow with Kotak Videos
Explore our comprehensive video library that blends expert market insights with Kotak's innovative financial solutions to support your goals.

Trading with collateral as margin with Kotak Neo

How India is Redefining Space Exploration

