

Kotak
Stockshaala
Chapter 4 | 3 min read
Fibonacci Retracement
A stock rallies ₹200 in six weeks from ₹300 to ₹500. Then it starts pulling back. You want to re-enter but have no objective way to determine how deep the pullback should go. Too early and you catch a falling knife. Too late and the move has already gone.
This is the problem Fibonacci retracement solves. It divides the prior move into proportional levels that have shown up consistently in market pullbacks for decades.
By the end of this chapter, you will be able to:
- Explain why Fibonacci ratios appear in financial markets and what they represent behaviourally.
- Draw a Fibonacci retracement correctly on any impulse swing.
- Identify which retracement levels are most significant for swing trading entries.
The Logic Behind the Levels
The key levels are 23.6%, 38.2%, 50%, 61.8%, and 78.6% retracements of a prior move. The 38.2% to 61.8% range is the primary entry window. To draw a Fibonacci retracement: identify the most recent significant swing low and the subsequent swing high. Draw the tool from low to high.
When a stock pulls back after a strong move, different participant groups re-enter at different depths. Early buyers re-enter at 23.6%. Most participants cluster between 38.2% and 61.8%. Deep value buyers appear at 61.8% to 78.6%. The levels work because enough participants use them as reference points.
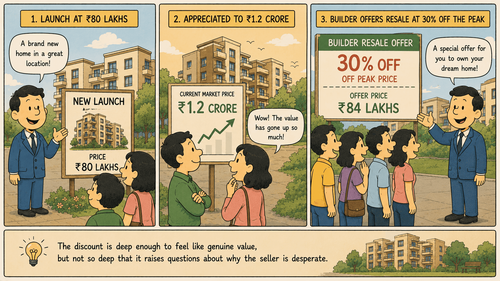
Think of a new flat in a residential project that launched at ₹80 lakhs, then appreciated to ₹1.2 crore. If the builder now offers resale at a discount of 30% off the peak, buyers flood back in: the discount is deep enough to feel like genuine value, but not so deep that it raises questions about why the seller is desperate. The 38.2% to 61.8% Fibonacci zone is that discount window applied to price.
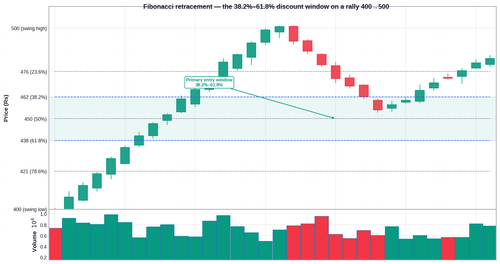
Using the rally from ₹300 to ₹500 (a ₹200 move), here are the key retracement levels:
Fib Level | Calculation | Price (Rs.) | Significance |
|---|---|---|---|
38.2% | 500 - (200 x 0.382) | ₹424 | Upper edge of primary entry window |
50.0% | 500 - (200 x 0.50) | ₹400 | Midpoint; frequently acts as support |
61.8% | 500 - (200 x 0.618) | ₹376 | Lower edge of primary entry window |
78.6% | 500 - (200 x 0.786) | ₹343 | Deep pullback; structure in question below this |
Common Mistakes
Mistake 1: Drawing the Fibonacci from the wrong swing points
Always draw from the most recent significant swing low to the most recent swing high. Drawing from older swings produces levels with no current structural relevance.
Mistake 2: Entering purely because price reaches a Fibonacci level
A Fibonacci level is a zone to watch. A rejection candle at the level, combined with intact structure and trend confirmation, is the entry signal.
Key Takeaways
- Fibonacci retracement levels divide a prior price swing into proportional zones. The 38.2% to 61.8% range is the primary entry window.
- Draw from the most recent significant swing low to swing high. The resulting levels show where different participant groups are likely to re-enter.
- A Fibonacci level is a zone to monitor, not a trigger. Entry requires a confirmation candle.
Assignment
Open the Nifty 50 daily chart. Find the most recent significant rally (a move of at least 5% with a clear swing low and swing high). Draw the Fibonacci retracement from that swing low to the swing high. Note the 38.2%, 50%, and 61.8% levels and their corresponding prices. Is Nifty currently in a pullback? Has it reached any of these levels? Was there a rejection candle at any of them? Record your observations.
In the next module, we move into indicators — starting with the Supertrend, one of the clearest and most widely used trend-confirmation tools in the Indian market.
Disclaimer: This article is for informational purposes only and does not constitute financial advice. It is not produced by the desk of the Kotak Neo Research Team, nor is it a report published by the Kotak Neo Research Team. The information presented is compiled from several secondary sources available on the internet and may change over time. Investors should conduct their own research and consult with financial professionals before making any investment decisions. Read the full disclaimer here.
Investments in securities market are subject to market risks, read all the related documents carefully before investing. Brokerage will not exceed SEBI prescribed limit. The securities are quoted as an example and not as a recommendation. SEBI Registration No-INZ000200137 Member Id NSE-08081; BSE-673; MSE-1024, MCX-56285, NCDEX-1262.
Recommended Courses for you



















Learn, Invest, and Grow with Kotak Videos
Explore our comprehensive video library that blends expert market insights with Kotak's innovative financial solutions to support your goals.

Trading with collateral as margin with Kotak Neo

How India is Redefining Space Exploration

