

Kotak
Stockshaala
Chapter 2 | 3 min read
वॉल्यूम प्रोफाइल: मार्केट का एक्स-रे (Volume Profile: The Market's X-Ray)
स्टॉक क्यों धीमा हो जाता है और रुक जाता है जब चार्ट पर कोई स्पष्ट हॉरिजॉन्टल सपोर्ट (horizontal support) या रेजिस्टेंस (resistance) नहीं होता? यह तेजी से तेज़ क्यों हो जाता है लेकिन फिर से एक दिखने में रैंडम लेवल (random level) पर रुक जाता है? केवल प्राइस (price) पर आधारित स्टैंडर्ड टेक्निकल एनालिसिस (standard technical analysis) अक्सर इन सवालों का साफ़ जवाब नहीं दे पाता।
वॉल्यूम प्रोफाइल (Volume Profile) दे सकता है। यह केवल यह नहीं दिखाता कि प्राइस कहाँ ट्रेड किया गया है, बल्कि प्रत्येक प्राइस लेवल (price level) पर कितना ट्रेडिंग एक्टिविटी (trading activity) हुआ है यह भी दिखाता है।
इस अध्याय के अंत तक, आप सक्षम होंगे:
- वॉल्यूम प्रोफाइल (Volume Profile) का इंटरप्रेटेशन (interpretation) करना और पॉइंट ऑफ कंट्रोल (Point of Control), हाई वॉल्यूम नोड्स (High Volume Nodes), और लो वॉल्यूम नोड्स (Low Volume Nodes) की पहचान करना।
- इन जोन्स (zones) का उपयोग करके प्राइस टारगेट्स (price targets) सेट करना और रेजिस्टेंस (resistance) या एक्सेलेरेशन (acceleration) के क्षेत्रों का पूर्वानुमान लगाना।
- वॉल्यूम प्रोफाइल (Volume Profile) को प्राइस स्ट्रक्चर (price structure) के साथ मिलाकर उच्च गुणवत्ता वाले स्विंग ट्रेड (swing trade) जोन्स की पहचान करना।
मुख्य घटक
घटक | परिभाषा | ट्रेडिंग इम्प्लीकेशन |
|---|---|---|
पॉइंट ऑफ कंट्रोल (POC) | वह प्राइस लेवल जहाँ अवधि के दौरान सबसे अधिक ट्रेडिंग वॉल्यूम (trading volume) हुआ | यह प्राइस मैगनेट (price magnet) के रूप में काम करता है; ट्रेंडिंग मूव्स (trending moves) के बाद प्राइस POC पर लौटने की प्रवृत्ति होती है |
हाई वॉल्यूम नोड (HVN) | एक प्राइस रेंज जहाँ महत्वपूर्ण दो-तरफा ट्रेडिंग (two-sided trading) हुई | यहाँ पर प्राइस धीमा हो जाता है; भीड़ और संभावित रिवर्सल्स (reversals) की उम्मीद करें |
लो वॉल्यूम नोड (LVN) | एक प्राइस रेंज जहाँ बहुत कम ट्रेडिंग हुई | प्राइस यहाँ तेजी से गुजरता है; LVNs लक्ष्य और ट्रांज़िशन जोन्स (transition zones) हैं |
जहाँ बाजार ने भारी लेन-देन किया है, वह धीरे चलता है। जहाँ उसने कम लेन-देन किया है, वह तेजी से चलता है।
इसे पीक आवर्स (peak hours) में एक व्यस्त रेलवे जंक्शन और आधी रात को एक खाली स्टेशन के रूप में सोचें। निफ्टी 50 (Nifty 50) लो वॉल्यूम नोड्स (Low Volume Nodes) के माध्यम से तेजी से गुजरता है — ये आपके लक्ष्य हैं। यह हाई वॉल्यूम नोड्स (High Volume Nodes) के माध्यम से धीमा हो जाता है और संघर्ष करता है — ये आपके रेजिस्टेंस जोन्स हैं।
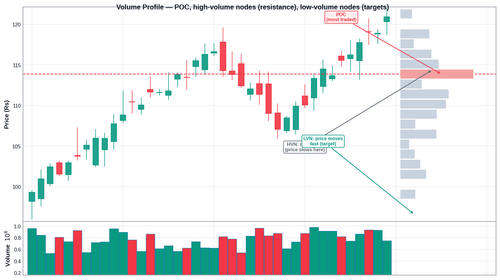
500 रुपए की वर्तमान कीमत के साथ एक स्टॉक सेटअप पर लागू:
ज़ोन | प्राइस लेवल | प्रकार | क्या उम्मीद करें |
|---|---|---|---|
पीओसी | ₹500 | पॉइंट ऑफ कंट्रोल (point of control) | उच्चतम गतिविधि; पुलबैक पर प्राइस मैगनेट |
एचवीएन 1 | ₹488 से ₹495 | हाई वॉल्यूम नोड (high volume node) | इस रेंज में प्राइस धीमा होगा और समेकित होगा |
एलवीएन 1 | ₹506 से ₹518 | लो वॉल्यूम नोड (low volume node) | यदि प्राइस ₹495 को तोड़ता है, तो यह तेजी से ₹518 तक जाएगा |
एचवीएन 2 | ₹518 से ₹530 | हाई वॉल्यूम नोड (high volume node) | रेजिस्टेंस जोन; ऊपर की ओर मूव पर प्राइस यहां रुक सकता है |
सामान्य गलतियाँ
गलती 1: वॉल्यूम प्रोफाइल का उपयोग प्राइस स्ट्रक्चर के संदर्भ के बिना करना
वॉल्यूम प्रोफाइल दिखाता है कि कहां गतिविधि हुई है। यह दिशा नहीं दिखाता। हमेशा प्राइस स्ट्रक्चर एनालिसिस के साथ मिलाकर उपयोग करें।
गलती 2: एचवीएन पर लक्ष्य सेट करना बिना दृष्टिकोण दिशा को ध्यान में रखे
एक एचवीएन अलग तरीके से काम करता है, यह इस पर निर्भर करता है कि प्राइस नीचे से आ रहा है या ऊपर से। नीचे से यह रेजिस्टेंस है। ऊपर से यह सपोर्ट है।
मुख्य बातें
- पॉइंट ऑफ कंट्रोल (point of control) सबसे उच्च वॉल्यूम प्राइस लेवल है और प्राइस मैगनेट के रूप में कार्य करता है। हाई वॉल्यूम नोड्स (high volume nodes) प्राइस को धीमा करते हैं। लो वॉल्यूम नोड्स (low volume nodes) इसे तेज करते हैं।
- ब्रेकआउट्स के बाद प्राइस टार्गेट्स के रूप में एलवीएन (LVNs) का उपयोग करें। ट्रेंडिंग मूव के रुकने की संभावना के लिए एचवीएन (HVNs) का उपयोग करें।
- जब प्राइस स्ट्रक्चर के साथ मिलाया जाता है, तो वॉल्यूम प्रोफाइल (volume profile) ज़ोन आइडेंटिफिकेशन में सटीकता जोड़ता है।
असाइनमेंट
यदि आपका ट्रेडिंग प्लेटफॉर्म वॉल्यूम प्रोफाइल (volume profile) का समर्थन करता है, तो निफ्टी 50 चार्ट पर 3-महीने का वॉल्यूम प्रोफाइल लागू करें। पीओसी (POC), वर्तमान प्राइस के ऊपर के दो निकटतम एचवीएन (HVNs), और उनके बीच कोई भी एलवीएन (LVNs) पहचानें। इन लेवल्स को अपने ट्रेड प्लान में नोट करें। अगली बार जब निफ्टी इन लेवल्स में से किसी एक के पास हो, तो देखें कि प्राइस कैसे व्यवहार करता है — क्या यह तेज होता है या रुकता है?
अगले अध्याय में, हम प्राइस एक्शन, इंडिकेटर्स और वॉल्यूम प्रोफाइल (volume profile) को एक सिंगल लेयर्ड कंफर्मेशन सिस्टम में मिलाते हैं — ताकि आप किसी भी स्विंग सेटअप की दृढ़ता का मूल्यांकन सभी तीन लेंसों का उपयोग करके कर सकें।
This content has been translated using a translation tool. We strive for accuracy; however, the translation may not fully capture the nuances or context of the original text. If there are discrepancies or errors, they are unintended, and we recommend original language content for accuracy.
Disclaimer: This article is for informational purposes only and does not constitute financial advice. It is not produced by the desk of the Kotak Neo Research Team, nor is it a report published by the Kotak Neo Research Team. The information presented is compiled from several secondary sources available on the internet and may change over time. Investors should conduct their own research and consult with financial professionals before making any investment decisions. Read the full disclaimer here.
Investments in securities market are subject to market risks, read all the related documents carefully before investing. Brokerage will not exceed SEBI prescribed limit. The securities are quoted as an example and not as a recommendation. SEBI Registration No-INZ000200137 Member Id NSE-08081; BSE-673; MSE-1024, MCX-56285, NCDEX-1262.
Recommended Courses for you















Learn, Invest, and Grow with Kotak Videos
Explore our comprehensive video library that blends expert market insights with Kotak's innovative financial solutions to support your goals.

Trading with collateral as margin with Kotak Neo

How India is Redefining Space Exploration