Long-Legged Doji: The Candlestick That Signals Market Confusion
- Updated: 29 May 2026, 7:02 PM IST
- | 4m
- 1,169
 Add Preferred News Source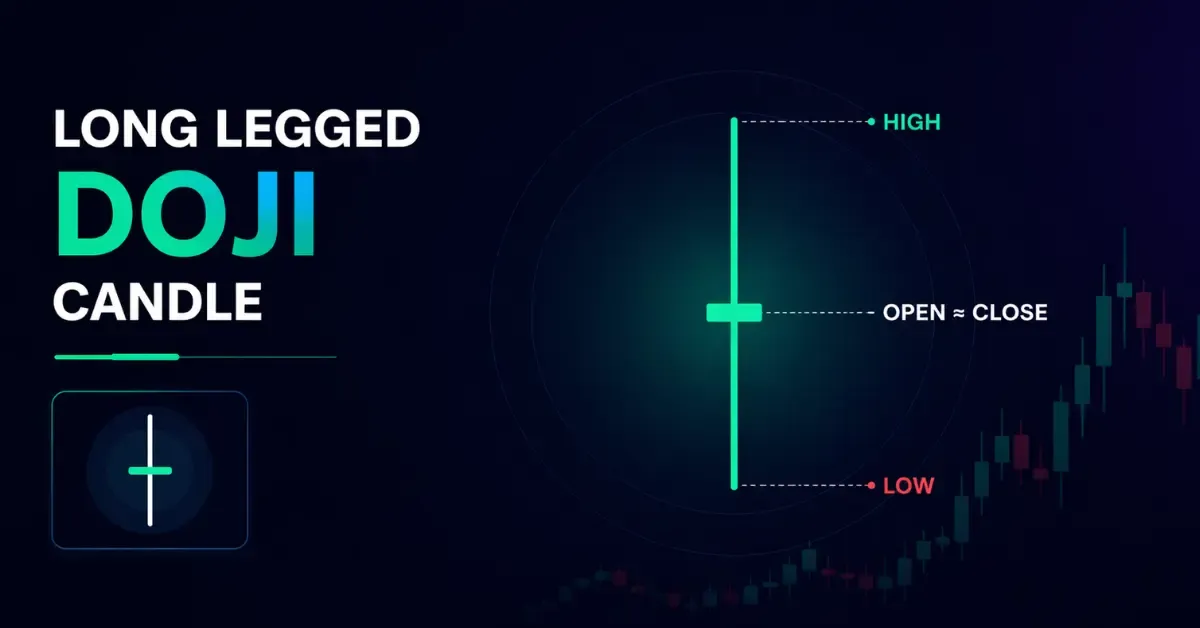
Imagine this. Two people are pulling a rope in two opposite directions with equal strength. The rope moves back and forth. However, in the end, it stays almost in the same place. In trading, the long-legged Doji candle signals exactly that when the closing price ends up near the opening price.
The Long-leg Doji is a popular candlestick chart pattern. This blog walks you through its key aspects and what it signals for traders.
What Is A Doji Candles Pattern?
A Doji candlestick pattern is a type of candlestick where the opening and closing prices are almost the same. Due to this, it has a very small or nearly invisible body. It shows that neither buyers nor sellers were able to take control during the trading period.
Doji candles usually appear when the market is uncertain, and there is indecision. Prices may move up and down during the session. However, they settle near where they started.
What Is A Long-Legged Doji?
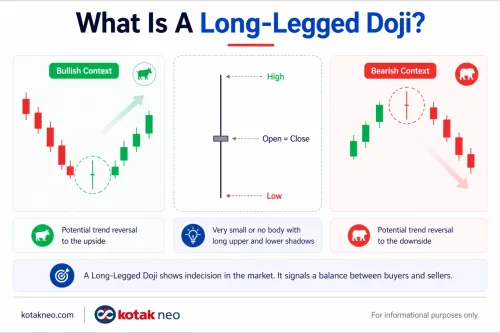
A long-leg Doji is a candle with long upper and lower shadows or wicks. These wicks show that prices moved a lot in both directions before closing near the opening level. This pattern says that both buyers and sellers tried to take control. However, in the end, neither side succeeds.
The result is a stalemate. The longer the shadows, the stronger the struggle between both parties. It can point towards a valuable signal that markets may be about to undergo a significant price movement.
How To Identify A Long-Legged Doji Pattern?
Now that you know the long-legged Doji candlestick meaning, let us see the way through which you can identify this pattern.
- Small Candle Body
The first thing you need to look for is the candle body. The candle body is small, almost invisible. It shows that neither buyers nor sellers are able to take control at the end of the session. The small body is one of the main features of a Doji candlestick pattern.
- Long Upper and Lower Shadows
A long-legged Doji candle has long wicks on both sides. This means the price moved significantly higher and lower during the session. These shadows show strong back-and-forth movement during trading hours.
- Equal Wick Length
Both wicks should be long and somewhat balanced. While they need not be exactly equal, both should clearly stand out. This balance shows that neither side had any advantage over the other.
What Does Long-Legged Doji Indicate?
This Doji candle is the primary signal of market confusion and indecision. It shows neither buyers nor sellers had control over the proceedings. While both sides tried, they ended up cancelling each other out. This pattern often appears when a trend is getting weak.
For example, after a strong start, it can hint that buyers are losing momentum. After a fall, it may suggest sellers are slowing down.
Long-Legged Doji Candle In Uptrend Vs Downtrend
In an uptrend, a long-legged Doji candle shows buyers’ weakness. Prices may rise during the day. However, they fail to stay high by the close. The trend may slow down, or even reverse.
A downtrend shows that selling pressure is reducing. Prices may fall. However, they recover before the session ends. This shows buyers are starting to step in.
Types Of Long-Legged Doji
There are two types of long-legged Doji candle patterns. These are:
Green Long-Legged Doji
A green Long-Legged Doji takes shape when the closing price is a little above the opening price. Even though small, it shows a slight edge for buyers. However, the long wicks still show indecision.
Red Long-Legged Doji
A red long-legged Doji is the opposite of its green counterpart. It appears when the closing price is a little below the opening price. This gives a small advantage to sellers.
Example Of Long-Legged Doji
Let us understand a long-legged Doji candlestick pattern with an example. Suppose you are following the share price of a stock. It:
-
Opens at ₹100
-
Hits a low of ₹92
-
Rises to a high of ₹108
-
Closes at ₹101
When it happens, it creates a long-legged Doji candlestick pattern. It shows that though buyers and sellers were active, none could take control.
Advantages And Limitations Of Long-Legged Doji
The long-leg Doji has several advantages and limitations, as outlined in the table below:
Advantages | Limitations |
|---|---|
Offers insights into market sentiments | Can give false signals occasionally |
Can help identify entry and exit points | Warrants skills and expertise for correct interpretation |
Can offer extra validation from other technical analysis tools, such as moving averages, Bollinger Bands, etc., for better decision-making | Need careful consideration of prevailing market conditions for proper implementation |
Conclusion
The long-legged Doji candle is one of the useful candlestick chart patterns that can help you understand market sentiment. That said, it is wise to use it with other technical indicators for better decision-making.
Source:
IG
FAQs On Long-Legged Doji
A long-legged Doji candle is neutral in itself. It can become bullish after a downtrend. On the other hand, it can become bearish after an uptrend.
The best timeframe differs across individuals, traders, and their choices. Those who want faster signals can use the intraday timeframe. On the other hand, those ready to adopt a wait-and-watch approach can use weekly timeframes.
The content in this blog is intended purely for educational purposes. Any securities or mutual funds referenced are illustrative in nature and do not constitute a recommendation or endorsement by Kotak Neo. Investors are encouraged to assess their own financial situation and seek professional advice before making any investment decisions. For compliance T&C and disclaimers, Visit www.kotakneo.com/disclaimer
0 people liked this article.

Kotak Neo (Kotak Neo) is India's venerable stockbroking company with a rich legacy. It offers comprehensive investment services across asset classes, prioritising a technology-first approach for a seamless experience. Trusted by 5 million+ customers, it guides you toward financial success with ease of investment and speed of trade.
Note: The opinions expressed in this blog are personal viewpoints and should not be construed as recommendations.