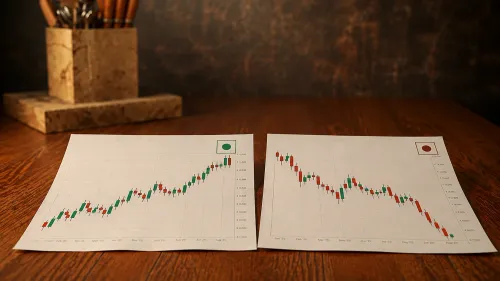
What is the advance-decline ratio (ADR) and how to use it in market analysis
- Updated: 22 May 2026, 5:09 PM IST
- | 5 min read
- 1,129
 Add Preferred News Source
Relying solely on index movement does not always give a fair or accurate idea of market sentiment. An index like the Nifty 50 or Sensex can be up, but if the majority of stocks within a market are down, then the rally may have little strength behind it. This is why the advance-decline ratio (ADR) is such a valuable analysis tool. It can provide much more than simply the headline numbers, you can look deeper into the participation, or lack of, behind market moves.
What is the advance-decline ratio (ADR)?
The advance-decline ratio is a market breadth indicator that measures the number of stocks that advanced in price to the number of stocks that declined (in a trading session). The advance-decline ratio is derived from this simple equation:
ADR = Number of advancing stocks / Number of declining stocks
If the ADR is above 1, it indicates more stocks are rising than falling, suggesting bullish sentiment. If it’s below 1, the reverse is true—more stocks are declining than advancing, which indicates bearishness.
For example, if out of 1,000 traded stocks on the NSE, 600 advanced and 400 declined, the ADR would be:
ADR = 600 / 400 = 1.5
This means that for every declining stock, 1.5 stocks moved higher, indicating a bullish tone in the market.
Why ADR matters more than just the index value
You may have noticed that on some days, Nifty is up 100 points with most of the stocks on your watchlist declining. This is because huge companies like Reliance, HDFC Bank, or Infosys may be lifting the index, even when the overall market is weak, and the ADR offers you a reality check.
ADR provides a measure of breadth or overall depth of market participation. An index that is upward advancing alongside an ADR that is declining is a warning flag that potentially portrays narrow leadership. And an index that is declining while the ADR is rising may indicate invisible strength lurking underneath the surface. ADR provides a way of getting beyond the letter of an index number and escaping the traps of a weak rally or false dip.
How to use ADR in market analysis
1. Identifying trend strength
If the market is trending upward and the ADR consistently stays above 1, it confirms that the uptrend is supported by broad participation. On the other hand, if the ADR starts declining even when prices rise, it indicates weakening momentum and a possible reversal.
2. Spotting divergences
One of the most effective ways to use ADR is to look for divergences between price movement and breadth. For instance, if the Sensex hits a new high but the ADR is falling or remains flat, it could be a sign of underlying weakness. Conversely, a rising ADR during a price correction may hint at a potential bounce-back.
3. Filtering out noise on volatile days
On days when there’s high volatility due to macroeconomic news or global cues, index moves can be erratic. The ADR helps you stay grounded. If the ADR stays balanced or neutral (around 1), it means the market may be choppy but not necessarily trending in one direction. You can then avoid impulsive trades based on index moves alone.
4. Sector-specific analysis
Advanced traders often apply ADR logic within specific sectors. For example, if banking stocks as a group show a rising ADR while the broader market is flat, it may be an early signal that the banking sector is preparing for a breakout. This gives you a sector rotation perspective, allowing better timing for positional trades.
5. Confirming breakouts and breakdowns
If a market breakout occurs on a day with a strong ADR (say above 2), the breakout is more likely to sustain. On the contrary, if the ADR is under 1 during a breakout, it may be a bull trap. The same logic applies in bearish conditions.
Different ways to interpret ADR
- ADR > 1: More advancing stocks than declining—bullish
- ADR = 1: Market is evenly balanced—neutral
- ADR < 1: More declining stocks—bearish
- ADR > 2 or < 0.5: Extreme sentiment—potential overbought or oversold conditions
Traders also track ADR across multiple timeframes, daily, weekly, and monthly, to identify shifts in longer-term participation trends.
How to access ADR data in India
Most trading platforms and financial news websites in India offer advance-decline data for NSE and BSE. NSE's official website shows the number of advancing, declining, and unchanged stocks on a real-time basis. Some brokers offer breadth indicators including ADR directly within their market overview dashboards. For deeper analysis, you can download daily EOD data and calculate rolling ADR ratios in Excel or Google Sheets to spot longer-term trends.
Conclusion
One of the main benefits of ADR is that it provides clarity. The Nifty index movement can tell you the health of the markets, but it doesn't necessarily tell you the complete story. The Nifty is skewed by a few heavyweight stocks, especially in the Indian markets. ADR gives you a more democratic view of the health of the markets.
FAQs
Yes, ADR can provide early insights about market direction even in the first 15 minutes of the trading session. Intraday traders use it to help confirm breakout or breakdown setups.
Yes, ADR works just fine for indices with a sectoral or size base. It can indicate whether the rally is broad-based in that segment or only a few stocks.
Generally, ADR above 2 usually is a sign of strong bullishness and below 0.5 is indicative of high bearishness. But always look at the ADR with price movement and volume to avoid wrong conclusions.
The content in this blog is intended purely for educational purposes. Any securities or mutual funds referenced are illustrative in nature and do not constitute a recommendation or endorsement by Kotak Neo. Investors are encouraged to assess their own financial situation and seek professional advice before making any investment decisions. For compliance T&C and disclaimers, Visit https://www.kotakneo.com/disclaimer/
0 people liked this article.