Chapter 6 | 3 min read
Understanding and Calculating Net Present Value (NPV) in Excel
Net Present Value (NPV) is a fundamental concept in finance that is used to determine the value of an investment by analysing the present value of future cash flows. It helps investors and companies assess the profitability of projects, making it an essential tool for making informed investment decisions.
In this blog, we’ll explore what NPV is, why it matters, and how to calculate it using Excel with a clear, step-by-step approach.
What is Net Present Value (NPV)?
Net Present Value (NPV) is the difference between the present value of cash inflows and outflows over a period of time. It accounts for the time value of money, meaning that a dollar today is worth more than a dollar in the future. NPV helps in evaluating whether an investment will yield a positive return or result in a loss.
The formula for NPV:
NPV = ∑(t=1)n [Ct / (1 + r)t] - C0
Where:
- Ct= Cash inflow during period t
- r = Discount rate (required rate of return)
- t = Time period (in years)
- C0 = Initial investment (cash outflow)
Why is NPV Important?
NPV helps investors understand whether the projected earnings from an investment exceed its costs. If the NPV is positive, it means the investment is likely to be profitable. A negative NPV suggests that the investment may result in a loss.
Example of NPV Calculation
Suppose you invest ₹10,000 today in a project expected to generate the following cash flows over 5 years:
1 | ₹2,500 |
2 | ₹3,000 |
3 | ₹3,500 |
4 | ₹4,000 |
5 | ₹4,500 |
If the required rate of return is 8%, we can calculate the NPV as follows:
NPV = 2500 / (1 + 0.08)1 + 3000 / (1 + 0.08)2 + 3500 / (1 + 0.08)3 + 4000 / (1 + 0.08)4 + 4500 / (1 + 0.08)5 - 10000
Calculating NPV in Excel
Excel provides a built-in NPV function that simplifies the calculation process.
Step-by-Step Guide to Calculate NPV in Excel:
- Set Up the Cash Flow Data:
- Column A: Year (1 to 5)
- Column B: Cash Flows (e.g., 2500, 3000, 3500, 4000, 4500)
- Use the NPV Formula:
- Place the discount rate (0.08) in a separate cell.
- Use the following formula to calculate NPV:
=NPV(0.08, B2:B6) - 10000
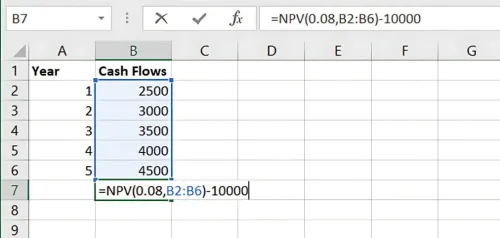
Result: 3,667.99
- Result: Positive or Negative Value indicating the NPV of the investment. Here, 0.08 represents the discount rate, and B2:B6 represents the range of future cash flows. Subtract the initial investment to get the final NPV.
Benefits of Using NPV
- Investment Evaluation: NPV helps determine the profitability of investment opportunities.
- Risk Assessment: A negative NPV can signal potential risks in a project.
- Decision-Making: NPV provides a quantitative measure for comparing multiple projects or investments.
Key Takeaways:
- NPV measures the value of future cash flows in today’s terms, making it a crucial tool in investment analysis.
- Positive NPV indicates potential profitability, while negative NPV suggests a loss.
- Excel’s NPV function makes calculating the present value of cash flows simple and efficient.
Conclusion:
Mastering NPV calculations is essential for any investor or business decision-maker. It provides clarity on whether a project or investment is worth pursuing based on its projected returns. Next Chapter Preview: In the next chapter, we’ll explore Calculating the Internal Rate of Return (IRR) for Investment Projects—a key metric for evaluating the profitability of investments, especially when comparing projects with different scales or durations. Stay tuned to learn how to compute IRR using Excel!
Recommended Courses for you


Learn, Invest, and Grow with Kotak Videos
Explore our comprehensive video library that blends expert market insights with Kotak's innovative financial solutions to support your goals.

Trading with collateral as margin with Kotak Neo

How India is Redefining Space Exploration

