

Kotak
Stockshaala
Chapter 6 | 2 min read
Calculating the Capital Asset Pricing Model (CAPM) in Excel
The Capital Asset Pricing Model (CAPM) is a fundamental tool used to estimate the expected return on an investment based on its risk relative to the market. CAPM helps investors assess whether an asset is fairly valued, given its risk and the expected market return. Excel’s functions make it easy to calculate CAPM, providing valuable insights into risk-adjusted performance.
Why Use CAPM?
- Risk-Adjusted Return: CAPM estimates return based on an asset’s sensitivity to market risk.
- Investment Decisions: Helps determine if an asset provides adequate returns for its risk.
- Portfolio Optimisation: Useful for weighing asset allocation decisions based on expected returns.
CAPM Formula
The CAPM formula calculates the expected return on an asset:
Expected Return (CAPM) = Risk-Free Rate + β × (Market Return - Risk-Free Rate)
Where:
- Risk-Free Rate is the return on a risk-free asset (e.g., government bonds).
- Beta measures the asset’s sensitivity to market movements.
- Market Return is the expected return of the overall market.
Step-by-Step Guide to Calculating CAPM in Excel
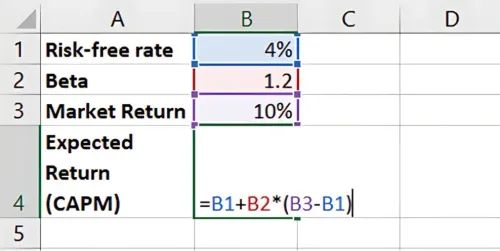
Step 1: Set Input Data
Assume you have the following parameters:
- Risk-Free Rate = 4%
- Beta of Stock = 1.2
- Market Return = 10%
Risk-Free Rate | 4% |
Beta | 1.2 |
Market Return | 10% |
Step 2: Apply the CAPM Formula in Excel
In Excel, input the CAPM formula:
= Risk-Free Rate + Beta * (Market Return - Risk-Free Rate)
For this example:
= 4% + 1.2 * (10% - 4%)
Result: The Expected Return (CAPM) is 11.2%. This is the return that compensates for both the time value of money and the investment’s risk.
Benefits of Using CAPM in Excel
- Quick Calculation: Excel’s functions allow for fast CAPM analysis.
- Scenario Analysis: Change inputs like Beta or Market Return to see different risk-adjusted returns.
- Investment Comparison: Compare the CAPM-derived expected returns of multiple assets.
Key Takeaways:
- CAPM calculates the expected return on an asset given its risk relative to the market.
- A higher beta results in a higher expected return due to increased sensitivity to market risk.
- Excel simplifies CAPM calculations, making it easy to incorporate into investment evaluations.
Conclusion
CAPM is an effective method for evaluating risk-adjusted returns, helping investors understand whether an investment aligns with their return expectations given its market risk. Using Excel, CAPM calculations are straightforward, enabling data-driven investment decisions.
Next Chapter Preview: In the next chapter, we’ll cover Weighted Average Cost of Capital (WACC) Calculation. WACC helps determine a company’s cost of capital, combining equity and debt costs, which is crucial for evaluating investments and financial decisions. Stay tuned!
Disclaimer: This article is for informational purposes only and does not constitute financial advice. It is not produced by the desk of the Kotak Neo Research Team, nor is it a report published by the Kotak Neo Research Team. The information presented is compiled from several secondary sources available on the internet and may change over time. Investors should conduct their own research and consult with financial professionals before making any investment decisions. Read the full disclaimer here.
Investments in securities market are subject to market risks, read all the related documents carefully before investing. Brokerage will not exceed SEBI prescribed limit. The securities are quoted as an example and not as a recommendation. SEBI Registration No-INZ000200137 Member Id NSE-08081; BSE-673; MSE-1024, MCX-56285, NCDEX-1262.
Recommended Courses for you


Learn, Invest, and Grow with Kotak Videos
Explore our comprehensive video library that blends expert market insights with Kotak's innovative financial solutions to support your goals.

Trading with collateral as margin with Kotak Neo

How India is Redefining Space Exploration


