


Kotak
Stockshaala
Chapter 5 | 2 min read
Portfolio Standard Deviation and Expected Return Calculation
Calculating Portfolio Standard Deviation and Expected Return is crucial for evaluating the risk-return profile of a portfolio. These metrics help investors understand both the average return they can expect and the volatility associated with their investment portfolio. By measuring these in Excel, investors can optimise their portfolios based on their risk tolerance and financial goals.
Why Calculate Portfolio Standard Deviation and Expected Return?
- Risk Assessment: Portfolio standard deviation indicates the portfolio’s risk level by measuring the variability of returns.
- Return Expectations: Expected return provides insight into the portfolio’s average expected growth.
- Portfolio Optimisation: Balance risk and return to achieve desired financial outcomes.
Formulas
- Expected Return: Weighted average of individual asset returns.
Expected Return = Σ (Weight of Asset × Expected Return of Asset)
- Portfolio Variance and Standard Deviation:
○ Portfolio Variance considers individual asset variances and covariances. ○ Portfolio Standard Deviation is the square root of the Portfolio Variance.
Step-by-Step Guide to Calculating Expected Return and Portfolio Standard Deviation in Excel
Step 1: Set Up Data for Assets
Suppose you have a two-asset portfolio with the following:
Stock A | 60% | 12% | 0.02 |
Stock B | 40% | 8% | 0.015 |
Step 2: Calculate Expected Portfolio Return
In Excel, multiply each asset’s weight by its expected return and then sum them up:
= (Weight A * Expected Return A) + (Weight B * Expected Return B)
For this example:
= (0.6 * 12%) + (0.4 * 8%)
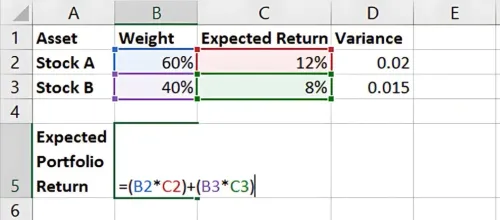
Result: Expected Portfolio Return is 10.4%.
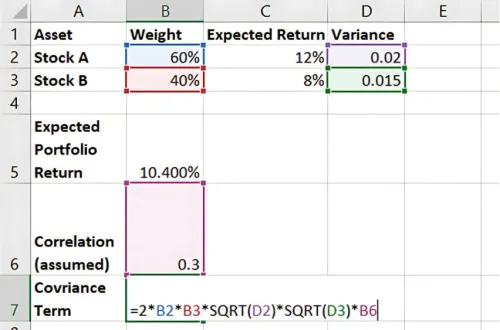
Step 3: Calculate Portfolio Variance
To calculate the portfolio variance, you need the covariance between assets or the correlation and standard deviations. For simplicity, assume a correlation of 0.3 between Stock A and Stock B. The formula is:
Portfolio Variance = ω_A² σ_A² + ω_B² σ_B² + 2ω_A ω_B σ_A σ_B ρ
In Excel:
Calculate the covariance term:
= 2 * Weight A * Weight B * SQRT(Variance A) * SQRT(Variance B) * Correlation
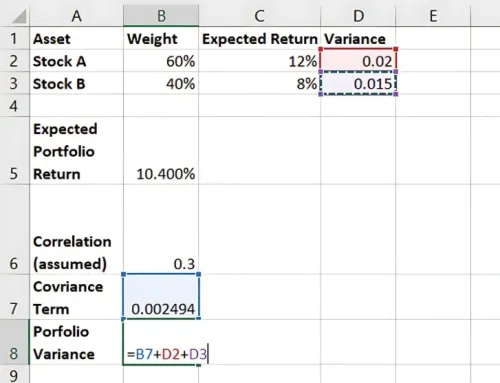
Sum up individual variances and the covariance term to find Portfolio Variance.
Step 4: Calculate Portfolio Standard Deviation
Take the square root of Portfolio Variance to get Portfolio Standard Deviation:
=SQRT(Portfolio Variance)
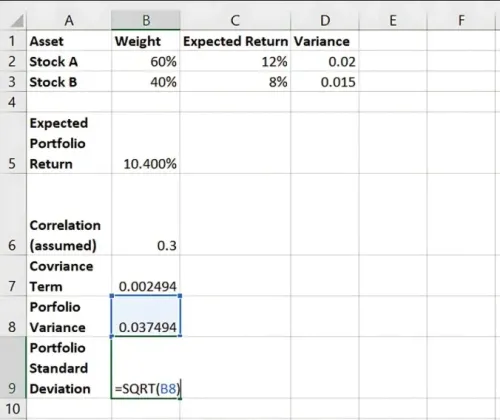
Result: The Portfolio Standard Deviation represents the overall risk.
Benefits of Calculating Portfolio Standard Deviation and Expected Return in Excel
- Accurate Risk-Return Profiling: Evaluate how expected returns align with portfolio risk.
- Flexibility: Easily adjust weights or asset correlations for different scenarios.
- Optimisation: Enables risk-averse or aggressive investors to adjust allocations.
Key Takeaways:
- Expected Return reflects average expected growth, while Portfolio Standard Deviation captures risk.
- Excel’s functions allow for easy calculation and scenario adjustments.
- Calculating these metrics is essential for balanced portfolio management.
Conclusion
By calculating Expected Return and Portfolio Standard Deviation, investors can better understand their portfolio’s risk-return tradeoff. Excel makes it easy to calculate these metrics, empowering you to create optimised, goal-oriented investment strategies.
Next Chapter Preview: In the next chapter, we’ll cover Calculating the Capital Asset Pricing Model (CAPM) in Excel. CAPM helps assess the expected return on an asset relative to its risk, offering insights into risk-adjusted performance. Stay tuned!
Recommended Courses for you


Learn, Invest, and Grow with Kotak Videos
Explore our comprehensive video library that blends expert market insights with Kotak's innovative financial solutions to support your goals.

Trading with collateral as margin with Kotak Neo

How India is Redefining Space Exploration

