


Kotak
Stockshaala
Chapter 4 | 2 min read
Sharpe Ratio Calculation to Evaluate Investment Risk
The Sharpe Ratio is a widely used measure that evaluates the risk-adjusted return of an investment. By calculating the excess return earned above the risk-free rate per unit of volatility or risk, the Sharpe Ratio helps investors assess whether they’re receiving adequate returns for the risks taken. A higher Sharpe Ratio indicates a more favourable risk-adjusted return, making it a critical tool in portfolio analysis.
Why Use the Sharpe Ratio?
- Risk-Adjusted Performance: Provides a clear measure of returns relative to risk.
- Comparison Tool: Helps compare the performance of different investments or portfolios.
- Decision Support: Identifies investments that offer the best returns for their risk level.
Sharpe Ratio Formula
The Sharpe Ratio formula is as follows:
Sharpe Ratio = (Portfolio Return - Risk-Free Rate) / Standard Deviation of Portfolio Returns
Where:
- Portfolio Return is the average return of the investment.
- Risk-Free Rate is the return on a risk-free investment, often based on government bonds.
- Standard Deviation of Portfolio Returns measures the volatility of returns.
Step-by-Step Guide to Calculating the Sharpe Ratio in Excel
Step 1: Gather Historical Returns Data
Set up your data for the investment’s returns over a specific period. Assume monthly returns for a stock portfolio.
Jan | 2.5% |
Feb | -1.2% |
Mar | 3.0% |
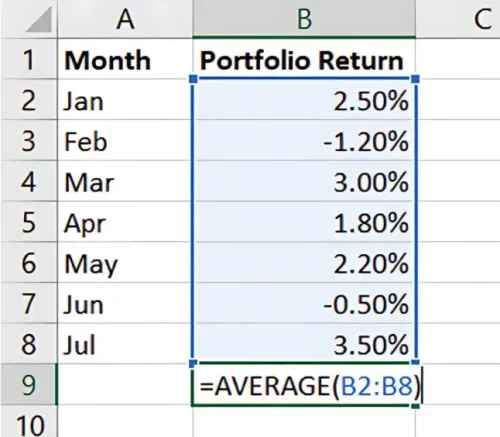
Step 2: Calculate the Average Return
In Excel, use the AVERAGE function to calculate the average monthly return:
=AVERAGE(Portfolio Return Range)
Step 3: Set the Risk-Free Rate
Input the annual risk-free rate, such as 6%, then convert it to a monthly rate if necessary (e.g., 6% / 12 months = 0.5%).
Risk-Free Rate - 0.5% (monthly)
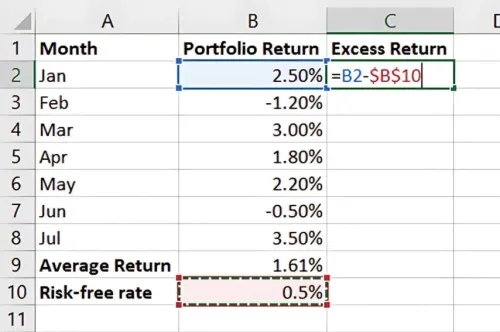
Step 4: Calculate Excess Return
Subtract the risk-free rate from each monthly portfolio return to get the Excess Return Use:
=Portfolio Return - Risk-Free Rate
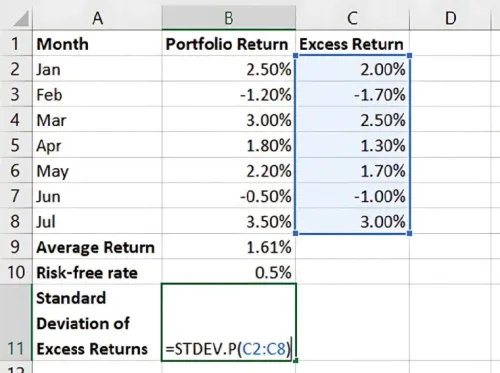
Step 5: Calculate the Standard Deviation of Excess Returns
Calculate the standard deviation of the excess returns using Excel’s STDEV.P function:
Step 6: Calculate the Sharpe Ratio
Now, apply the Sharpe Ratio formula in Excel:
= (Average Portfolio Return - Risk-Free Rate) / Standard Deviation of Excess Returns
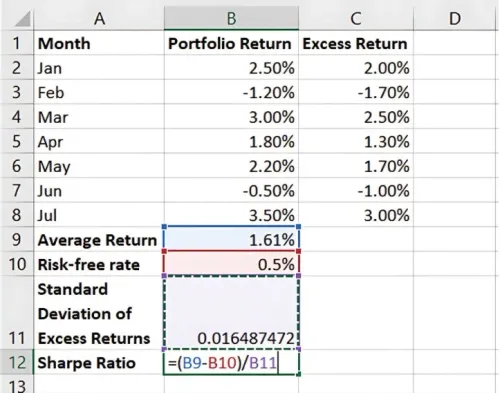
This provides the Sharpe Ratio, showing the risk-adjusted return for your portfolio.
Benefits of Sharpe Ratio in Excel
- Easy Risk Comparison: Compare the performance of multiple investments.
- Insightful Analysis: Understand if high returns are worth the risk.
- Quick Calculation: Excel automates calculations, saving time and ensuring accuracy.
Key Takeaways:
- The Sharpe Ratio evaluates returns relative to risk, helping investors identify efficient investments.
- Higher Sharpe Ratios are generally preferable, indicating better risk-adjusted returns.
- Excel’s functions simplify calculations, making it easy to incorporate Sharpe Ratios into portfolio analysis.
Conclusion
Calculating the Sharpe Ratio in Excel provides a reliable measure of an investment’s risk-adjusted return, guiding better investment decisions. With Excel’s functions, you can quickly calculate and compare the Sharpe Ratios of different portfolios.
Next Chapter Preview: In the next chapter, we’ll discuss Portfolio Standard Deviation and Expected Return Calculation. These metrics help measure portfolio volatility and expected gains, offering further insight into a portfolio’s overall performance. Stay tuned!
Recommended Courses for you


Learn, Invest, and Grow with Kotak Videos
Explore our comprehensive video library that blends expert market insights with Kotak's innovative financial solutions to support your goals.

Trading with collateral as margin with Kotak Neo

How India is Redefining Space Exploration

