


Kotak
Stockshaala
Chapter 3 | 2 min read
Creating a Stock Portfolio Tracker in Excel
A Stock Portfolio Tracker in Excel is an essential tool for monitoring your investments, tracking stock performance, calculating returns, and making informed investment decisions. A well-designed tracker provides a snapshot of your portfolio’s value, profit/loss, and diversification, all in one place.
Why Use a Portfolio Tracker?
- Performance Monitoring: Track gains and losses across different stocks.
- Portfolio Management: Review portfolio allocation and adjust as needed.
- Data-Driven Decisions: Leverage real-time data to make informed investment choices.
Key Elements of a Portfolio Tracker
- Stock Details: Stock name, ticker symbol, purchase price, and date of purchase.
- Performance Metrics: Current price, market value, and profit/loss.
- Returns Calculation: Percent gain/loss to evaluate stock performance.
- Portfolio Allocation: Allocation percentages to track diversification.
Step-by-Step Guide to Building a Stock Portfolio Tracker in Excel
Step 1: Set Up Stock Details
In Excel, create columns for each stock’s details, such as:
ABC Corp | ABC | ₹500 | 10 | ₹550 | ₹5,500 | ₹500 | 10% |
Step 2: Calculate Market Value
Use the formula:
= Current Price * Shares
For example:
= 550 * 10
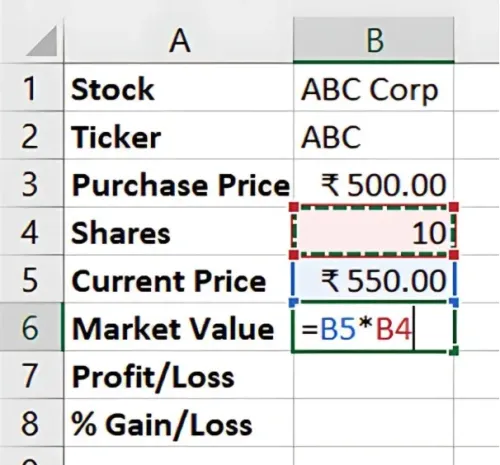
Result: Market Value is ₹5,500.
Step 3: Calculate Profit/Loss
Calculate the difference between Market Value and Purchase Price to find Profit/Loss.
= (Current Price - Purchase Price) * Shares
For example:
= (550 - 500) * 10
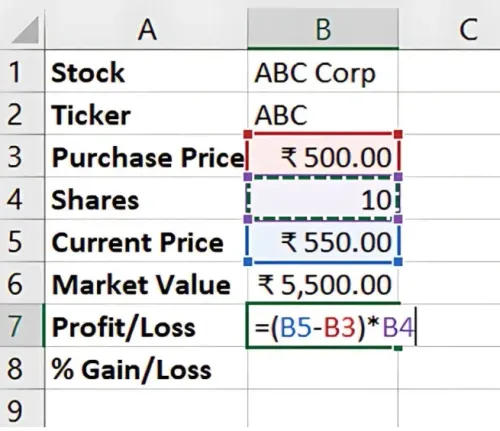
Result: Profit/Loss is ₹500.
Step 4: Calculate % Gain/Loss
Calculate percentage change to track performance.
= (Profit/Loss / (Purchase Price * Shares)) * 100
For example: = (500 / (500 * 10)) * 100
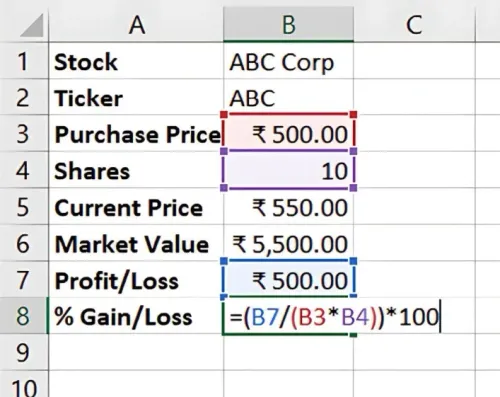
Result: % Gain/Loss is 10%.
Optional: Add Portfolio Allocation
To assess diversification, calculate each stock’s share of the total portfolio by dividing each Market Value by the total portfolio value:
= Market Value / Total Portfolio Value
Benefits of a Stock Portfolio Tracker in Excel
- Real-Time Insights: Track and update as prices change.
- Easy Customisation: Modify based on portfolio goals.
- Cost-Effective: Excel’s built-in formulas and customisation are free compared to other platforms.
Key Takeaways:
- A portfolio tracker enables efficient monitoring of stock performance.
- Regular updates help with timely decisions and adjustments.
- Excel’s flexibility allows for personalised tracking based on investment strategies.
Conclusion
A Stock Portfolio Tracker in Excel helps investors monitor performance, manage risk, and make data-driven investment decisions. By tracking details like profit/loss and allocation, you gain insights into your portfolio’s health.
Next Chapter Preview:
In the next chapter, we’ll cover Sharpe Ratio Calculation to Evaluate Investment Risk. The Sharpe Ratio is a key metric for assessing risk-adjusted returns, helping investors evaluate the performance of an investment relative to its risk. Stay tuned for a guide on calculating the Sharpe Ratio in Excel!
Recommended Courses for you


Learn, Invest, and Grow with Kotak Videos
Explore our comprehensive video library that blends expert market insights with Kotak's innovative financial solutions to support your goals.

Trading with collateral as margin with Kotak Neo

How India is Redefining Space Exploration

