


Kotak
Stockshaala
Chapter 2 | 2 min read
Stock Price Valuation Using Dividend Discount Model (DDM)
The Dividend Discount Model (DDM) is a popular method for valuing stocks that focuses on the present value of expected future dividends. DDM is particularly useful for valuing stocks with stable and predictable dividend payments. By estimating the stock's intrinsic value based on dividend payouts, investors can determine whether a stock is overvalued or undervalued relative to its current market price.
Why Use the Dividend Discount Model?
- Income Assessment: Great for valuing dividend-paying stocks, especially in sectors like utilities and financials.
- Investment Decisions: Helps determine if a stock is priced fairly based on projected dividend returns.
- Fundamental Analysis: A reliable model for long-term investors focused on stable income-generating stocks.
Key Types of DDM
- Gordon Growth Model: Assumes dividends grow at a constant rate, suitable for companies with stable growth.
- Multi-Stage DDM: Accounts for varying dividend growth rates, ideal for companies expected to change their growth over time.
The formula for the Gordon Growth Model (Constant Growth DDM)
For the Gordon Growth Model, the formula is:
Stock Price = Dividend per Share / (Discount Rate - Dividend Growth Rate)
Where:
- Dividend per Share = Expected annual dividend.
- Discount Rate = Required rate of return, often estimated by CAPM.
- Dividend Growth Rate = Estimated growth rate of dividends.
Step-by-Step Guide to Calculating Stock Price with DDM in Excel
Step 1: Input Key Parameters
Suppose a company has:
- Expected Dividend per Share = ₹5
- Discount Rate = 8%
- Dividend Growth Rate = 3%
Expected Dividend | ₹5 |
Discount Rate (r) | 8% |
Dividend Growth Rate (g) | 3% |
Step 2: Apply the DDM Formula in Excel
In Excel, use the formula:
= Expected Dividend / (Discount Rate - Dividend Growth Rate)
For this example:
=5 / (8% - 3%)
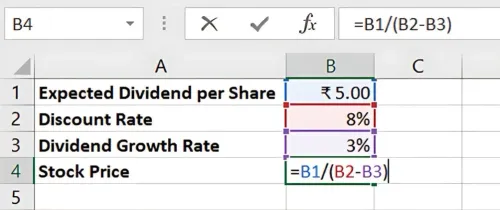
Result: The Stock Price is ₹100. This is the intrinsic value based on projected dividends, which can be compared to the stock's market price to assess valuation.
Multi-Stage DDM for Variable Growth
If dividends are expected to grow at different rates over time, the Multi-Stage DDM is more suitable. Excel’s NPV function can help sum up present values for each stage of growth.
Benefits of DDM in Excel
- Accurate Dividend Valuation: Useful for income-focused investors.
- Scalable: Easy to adjust for changing dividends and growth assumptions.
- Time-Efficient: Excel automates calculations, making DDM accessible and quick.
Key Takeaways:
- Gordon's Growth Model is ideal for stable, dividend-paying stocks with constant growth.
- Multi-stage DDM adapts to companies with different dividend growth rates over time.
- Excel’s NPV and formula functions simplify DDM calculations for accurate valuation.
Conclusion
The Dividend Discount Model is a robust method for valuing stocks that generate consistent dividend income. Excel’s functionalities make DDM calculations efficient, providing investors with a reliable tool for income-focused stock analysis.
Next Chapter Preview: In the next chapter, we’ll explore Creating a Stock Portfolio Tracker in Excel. A portfolio tracker allows investors to monitor stock performance, track gains or losses, and make data-driven investment decisions. Stay tuned for a step-by-step guide!
Recommended Courses for you


Learn, Invest, and Grow with Kotak Videos
Explore our comprehensive video library that blends expert market insights with Kotak's innovative financial solutions to support your goals.

Trading with collateral as margin with Kotak Neo

How India is Redefining Space Exploration

