


Kotak
Stockshaala
Chapter 1 | 2 min read
Beta Calculation for Stock Volatility in Excel
Beta measures a stock’s volatility relative to the overall market. It indicates how much a stock’s price is expected to change in response to changes in the market. A beta of 1 suggests the stock moves in line with the market, a beta above 1 indicates higher volatility than the market, and a beta below one shows lower volatility. Calculating beta in Excel provides a straightforward approach to understanding a stock’s risk and expected performance.
Why Calculate Beta?
- Risk Assessment: Understand how sensitive a stock is to market fluctuations.
- Portfolio Management: Helps construct diversified portfolios.
- Expected Return: Provides insights into the stock's expected movement relative to the market.
Formula for Beta
Beta is calculated by comparing the covariance between the stock’s returns and the market returns with the variance of the market returns:
Beta = Covariance (Stock Returns, Market Returns) / Variance (Market Returns)
Step-by-Step Guide to Calculating Beta in Excel
Step 1: Collect Historical Price Data
Gather historical daily or monthly price data for the stock and the market index (such as NIFTY 50 or S&P 500). Calculate daily or monthly returns based on this data.
Jan 1 | ₹500 | ₹10,000 | - | - |
Jan 2 | ₹510 | ₹10,200 | 2% | 2% |
Step 2: Calculate Daily or Monthly Returns
To find returns, use the formula:
= (Current Price - Previous Price) / Previous Price
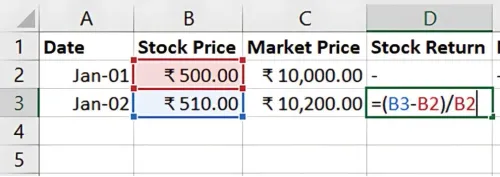
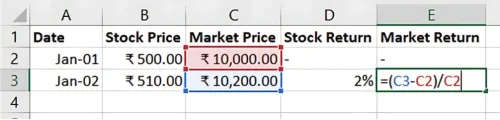
Repeat this calculation for both the stock and the market index.
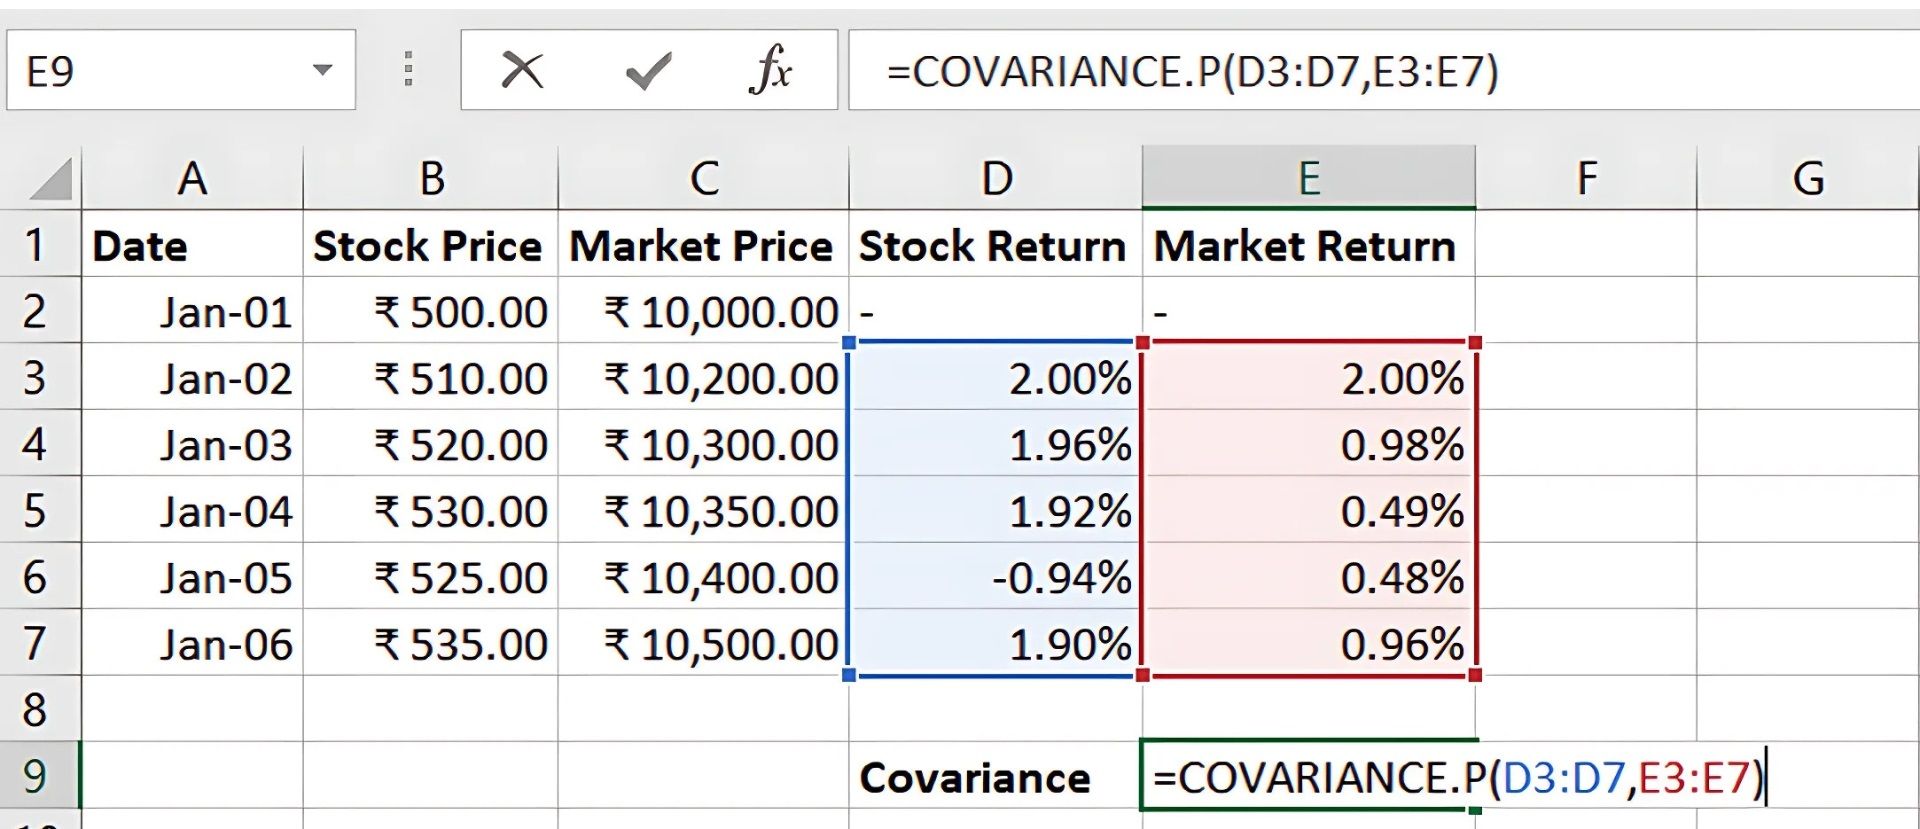
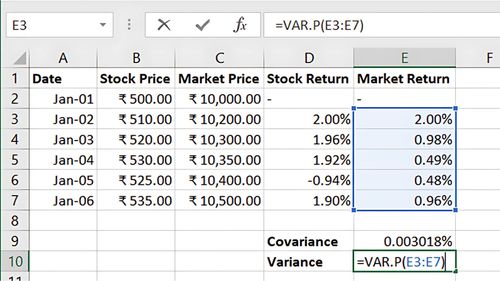
Step 3: Calculate Covariance and Variance
Covariance: Use Excel’s COVARIANCE.P function to calculate the covariance between stock and market returns.
=COVARIANCE.P(Stock Return Range, Market Return Range)
Variance: Use Excel’s VAR.P function to calculate the variance of the market returns.
=VAR P(Market Return Range)
Step 4: Calculate Beta
Using the results from the covariance and variance calculations, compute beta:
= Covariance / Variance
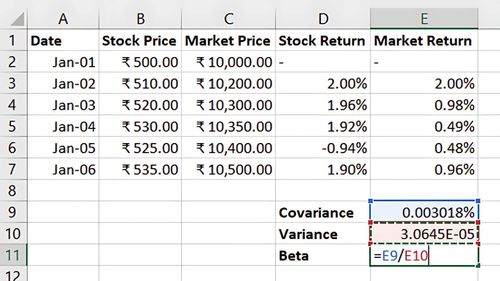
This gives you the stock’s beta, showing its volatility relative to the market.
Benefits of Calculating Beta in Excel
- Quick Insights: Easily determine a stock’s relative risk.
- Customisable Data: Use different time frames (daily, monthly) for tailored analysis.
- Portfolio Analysis: Identify high- and low-volatility stocks to optimise portfolios.
Key Takeaways:
- Beta shows the sensitivity of a stock’s price to market movements.
- A beta above 1 implies more volatility, while a beta below 1 indicates stability.
- Excel’s built-in functions simplify the beta calculation, supporting informed investment decisions.
Conclusion
Calculating beta provides valuable insights into a stock’s volatility relative to the market, helping investors assess risk and build diversified portfolios. Excel makes this process efficient, allowing for quick analysis and decision-making.
Next Chapter Preview:
In the next chapter, we’ll cover Stock Price Valuation Using Dividend Discount Model (DDM), a fundamental model for estimating stock value based on expected dividends. DDM helps investors evaluate stocks with stable dividend payouts. Stay tuned!
Recommended Courses for you


Learn, Invest, and Grow with Kotak Videos
Explore our comprehensive video library that blends expert market insights with Kotak's innovative financial solutions to support your goals.

Trading with collateral as margin with Kotak Neo

How India is Redefining Space Exploration

