


Kotak
Stockshaala
Chapter 3 | 2 min read
Sensitivity Analysis: Scenario Building in Excel for Financial Models
Sensitivity analysis is essential for testing the impact of varying assumptions on financial models, helping businesses understand potential risks and outcomes. By creating scenarios in Excel, you can assess how changes in key variables (such as sales volume, costs, or interest rates) affect results, offering insights for strategic decision-making.
Why Use Sensitivity Analysis?
-
Identify Key Drivers: Understand which variables have the most impact on outcomes.
-
Risk Assessment: Explore best-case, worst-case, and base scenarios to gauge risk exposure.
-
Data-Driven Decisions: Make informed choices by testing different financial assumptions.
Key Techniques for Sensitivity Analysis in Excel
-
What-If Analysis: Allows you to test different inputs for specific variables.
-
Data Tables: Create one-variable and two-variable data tables for multiple scenarios.
-
Scenario Manager: Compare multiple named scenarios within the same worksheet.
Step-by-Step Guide to Building Sensitivity Analysis in Excel
Step 1: Set Up Your Financial Model
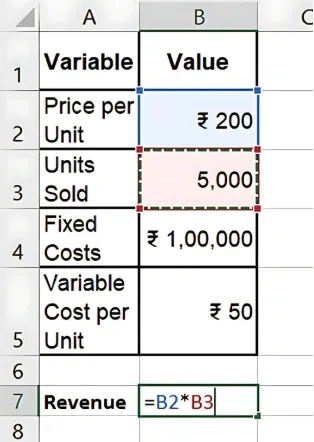
Suppose you have a basic profit model:
-
Revenue = Price per Unit × Units Sold
-
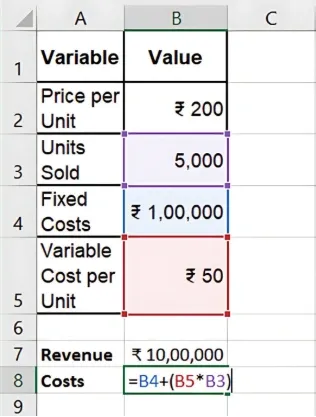
Costs = Fixed Costs + (Variable Costs per Unit × Units Sold)
-
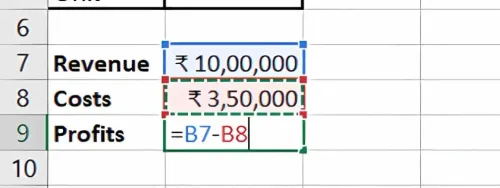
Profit = Revenue - Costs
Price per Unit | ₹200 |
Units Sold | 5,000 |
Fixed Costs | ₹100,000 |
Variable Cost per Unit | ₹50 |
Step 2: Use What-If Analysis to Test Variables
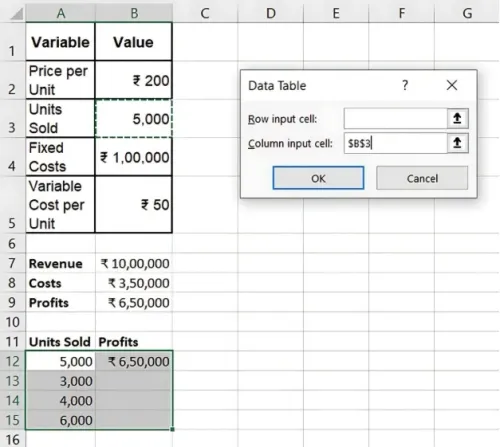
To analyse how changes in Units Sold affect Profit:
-
Select Data > What-If Analysis > Data Table.
-
In the Column Input Cell, select Units Sold.
-
Excel will generate different profit outcomes based on varying units sold.
Step 3: Create a One-Variable Data Table
-
List possible values for Units Sold in a column (e.g., 4,000, 5,000, 6,000).
-
Link the Profit cell in the table header.
-
Use Data > What-If Analysis > Data Table and specify Units Sold as the input.
Step 4: Use Scenario Manager for Complex Scenarios
Scenario Manager lets you save and compare scenarios:
- Go to Data > What-If Analysis > Scenario Manager.

-
Define scenarios (e.g., Best Case, Base Case, Worst Case).
-
Input varying values for each scenario to assess impacts on overall profitability.
Benefits of Sensitivity Analysis in Excel
-
Enhanced Decision-Making: Test how different variables affect outcomes, aiding strategy.
-
Risk Management: Identify and quantify risks, enabling proactive measures.
-
Improved Forecast Accuracy: Evaluate how assumptions influence forecasts, adjusting accordingly.
Key Takeaways:
-
Sensitivity analysis allows you to identify which variables are crucial to financial outcomes.
-
Excel’s What-If Analysis and Scenario Manager simplify scenario comparisons.
-
Use sensitivity analysis for data-backed decisions in uncertain situations.
Conclusion
Conducting sensitivity analysis in Excel equips you with a powerful tool for understanding financial model dynamics, enabling better planning and risk management.
Next Chapter Preview: In the next chapter, we’ll dive into Rolling Forecasts: How to Create and Update in Excel. Rolling forecasts help businesses continuously adjust predictions based on actual performance, offering greater flexibility in planning. Stay tuned!
Recommended Courses for you


Learn, Invest, and Grow with Kotak Videos
Explore our comprehensive video library that blends expert market insights with Kotak's innovative financial solutions to support your goals.

Trading with collateral as margin with Kotak Neo

How India is Redefining Space Exploration

