


Kotak
Stockshaala
Chapter 2 | 2 min read
Sales Forecasting Techniques: Trend and Seasonal Analysis
Sales forecasting is crucial for planning and making informed business decisions. Understanding sales trends and seasonality helps businesses anticipate demand and allocate resources efficiently. With Excel, you can apply various forecasting techniques to analyse past sales data, detect patterns, and project future performance.
Why Use Trend and Seasonal Analysis?
-
Trends: Show long-term growth or decline, helping you understand general sales direction.
-
Seasonality: Highlights recurring patterns, such as increased demand during holidays or specific seasons.
By using trend and seasonal analysis, you can make more accurate forecasts that account for both ongoing changes and predictable fluctuations.
Key Techniques for Sales Forecasting in Excel
-
Moving Averages: Smooths out data to identify underlying trends.
-
Linear Regression: Models the relationship between sales and time to project future values.
-
Seasonal Adjustment: Accounts for cyclical demand variations.
Step-by-Step Guide for Trend and Seasonal Analysis
Step 1: Organise Historical Data
Gather your historical sales data, ensuring it’s organised by date. You may have monthly, quarterly, or yearly sales figures.
Jan 2022 | ₹5,000 |
Feb 2022 | ₹6,500 |
... | ... |
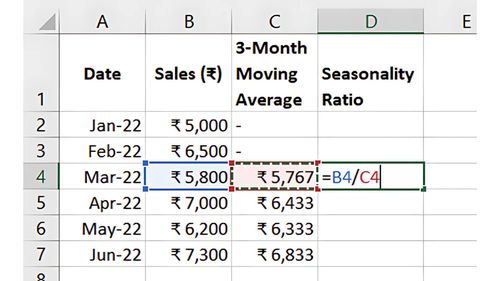
Step 2: Calculate Moving Averages
Moving averages help smooth out short-term fluctuations, revealing long-term trends. To calculate a 3-month moving average in Excel, use:
=AVERAGE(B2:B4)
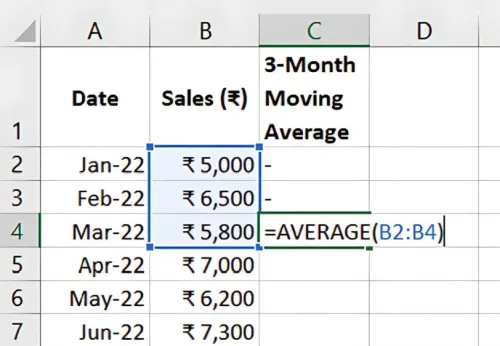
Drag this formula down to apply it to your entire data set, helping visualise underlying trends without short-term noise.
Step 3: Apply Linear Regression for Trend Analysis
Use Excel’s LINEST or TREND functions to apply linear regression. Alternatively, you can add a Trendline to a chart:
- Select your data and create a scatter plot.
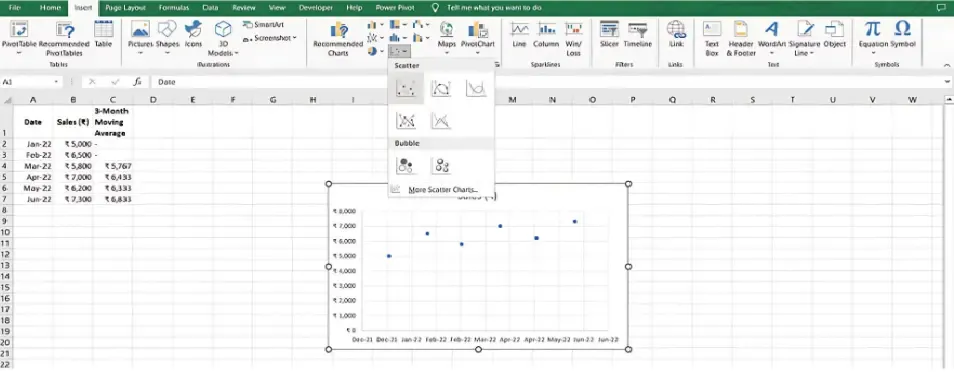
- Right-click on the data points, choose Add Trendline and select Linear
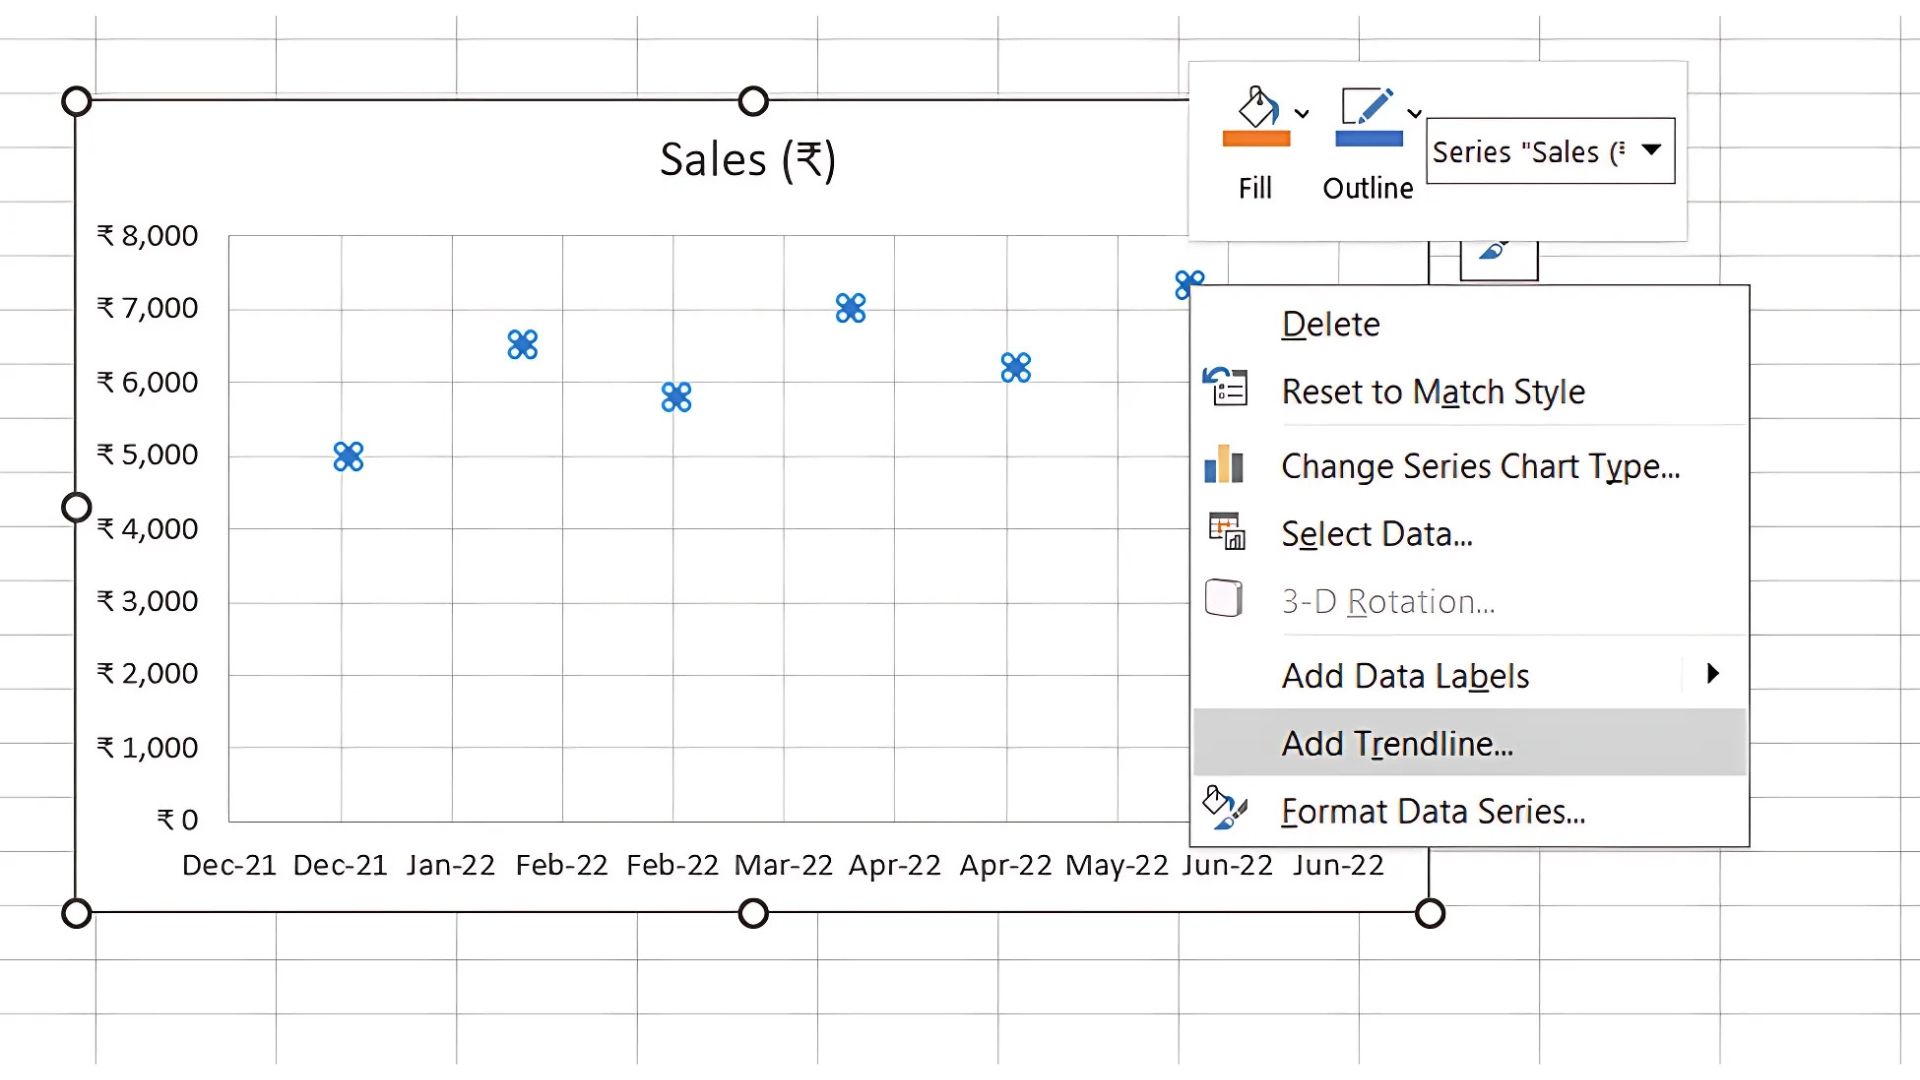
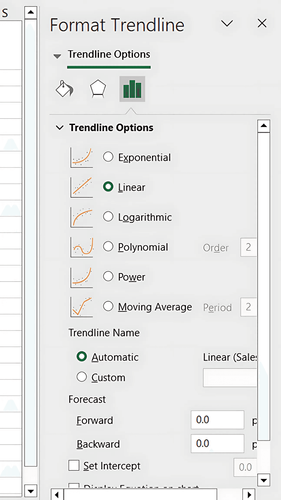
Excel will calculate the slope and intercept, projecting the trend line based on historical data.
Step 4: Analyse Seasonality with Seasonal Index
Identify seasonal factors by calculating the Seasonal Index for each period. To create this:
- Divide actual sales by the moving average or trend line value to find a seasonality ratio.
- Average these ratios by period (e.g., each January) to create seasonal indices.
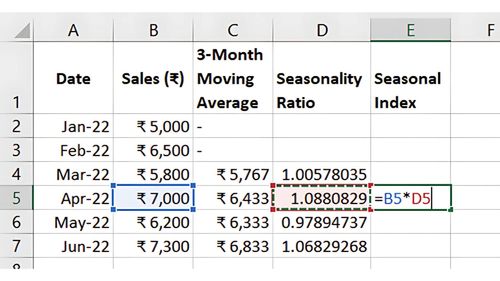
Applying the seasonal index to projected trend values will adjust for recurring seasonal variations.
Benefits of Sales Forecasting in Excel
-
Improved Decision-Making: Allows better resource planning and inventory management.
-
Financial Planning: Aligns cash flow and budgeting with anticipated sales trends.
-
Customer Satisfaction: Ensures that customer demand is met, even during high-demand periods.
Key Takeaways:
-
Moving Averages and Linear Regression help identify trends, while Seasonal Indexing captures cyclic patterns.
-
Excel’s Charting Tools and Forecasting Functions simplify sales forecasting, offering a robust basis for projections.
Conclusion
With trend and seasonal analysis in Excel, you gain valuable insights into sales patterns that enhance forecasting accuracy. This enables more effective decision-making, resource allocation, and strategic planning.
Next Chapter Preview: In the next chapter, we’ll explore Sensitivity Analysis: Scenario Building in Excel for Financial Models. This powerful technique will show you how to test different scenarios, helping you understand how changes in assumptions impact outcomes. Stay tuned!
Recommended Courses for you


Learn, Invest, and Grow with Kotak Videos
Explore our comprehensive video library that blends expert market insights with Kotak's innovative financial solutions to support your goals.

Trading with collateral as margin with Kotak Neo

How India is Redefining Space Exploration

