


Kotak
Stockshaala
Chapter 1 | 2 min read
Creating a Dynamic Budgeting Template in Excel
Budgeting is essential for tracking income, expenses, and financial goals. A dynamic budgeting template offers flexibility, allowing you to adjust budgeted values, monitor actuals, and analyse variances over time. Excel is an ideal tool for creating such templates, with features that make budgeting both interactive and efficient.
Why Use a Dynamic Budgeting Template?
-
Flexibility: Quickly update income or expense categories as circumstances change.
-
Comparative Analysis: Compare budgeted versus actual amounts to monitor spending.
-
Goal Tracking: Set monthly, quarterly, or yearly goals and track your progress.
Key Elements of a Dynamic Budgeting Template
-
Income and Expense Categories: Separate your income sources and expense categories.
-
Budgeted vs. Actual Values: Track what you plan to spend or save versus what actually occurs.
-
Variance Analysis: Analyse differences between budgeted and actual values for better insights.
-
Monthly/Annual Totals: Aggregate data monthly and annually to see big-picture trends.
Step-by-Step Guide to Building a Budgeting Template
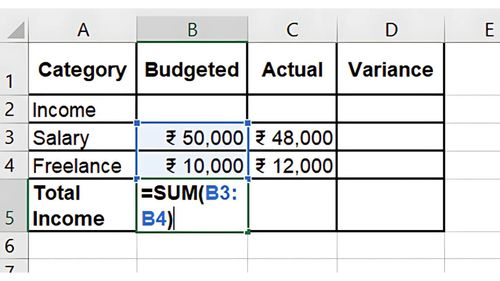
Step 1: Set Up Categories and Layout
In Excel, create sections for:
-
Income: List sources such as salary, business income, or dividends.
-
Expenses: Common categories include rent, groceries, utilities, entertainment, etc.
-
Totals and Variance: Sum income and expenses and calculate variances.
Income | |||
Salary | ₹50,000 | ₹48,000 | ₹-2,000 |
Freelance | ₹10,000 | ₹12,000 | ₹2,000 |
Total Income | ₹60,000 | ₹60,000 | ₹0 |
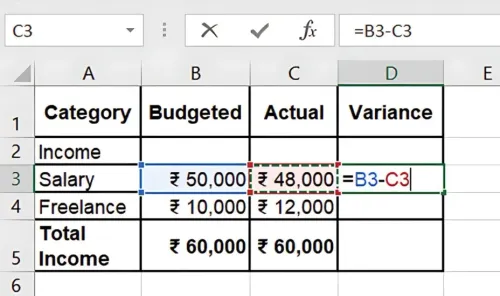
Step 2: Use Formulas to Calculate Totals and Variances
- For Total Income/Expenses, use =SUM(range) to sum each category.
- For Variance: Calculate the difference between Budgeted and Actual with =Budgeted - Actual.
Step 3: Add Monthly/Annual Views
Expand the table to include each month in a separate column for tracking changes over time. You can use Excel’s Table format to make data entry more manageable and dynamic.
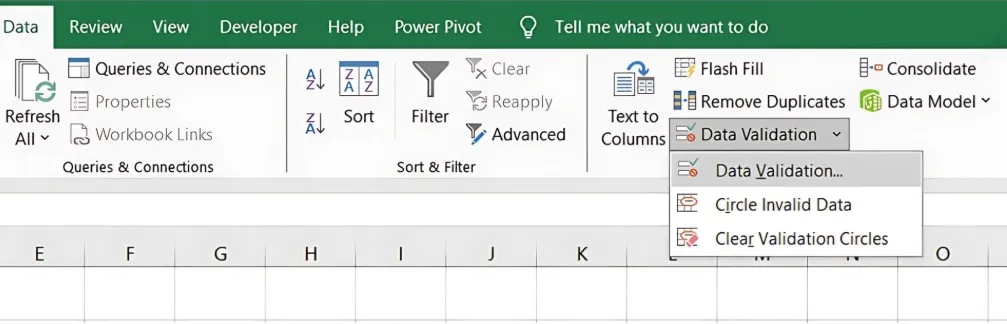
Step 4: Create Interactive Features
- Data Validation: Add dropdowns for category selection.
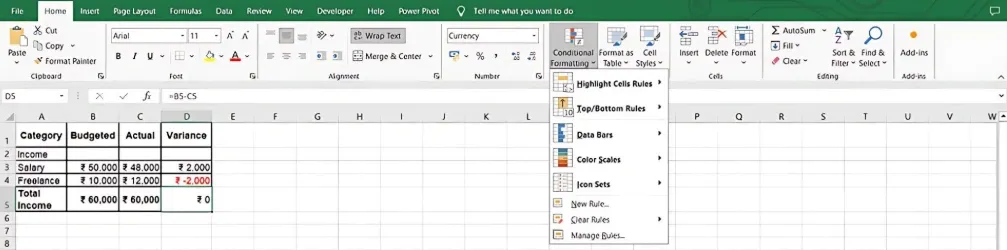
- Conditional Formatting: Highlight variances to easily spot overspending or underspending.
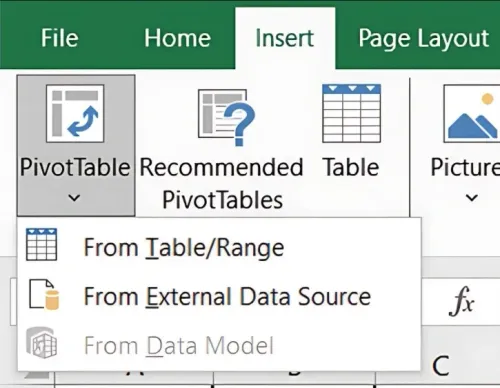
- Pivot Tables: Summarise data dynamically by month, category, or year.
Key Benefits of a Dynamic Budgeting Template
-
Real-Time Analysis: Excel formulas and formatting allow for instant insights.
-
Automated Calculations: Excel automates totals, making the budgeting process accurate and efficient.
-
Customised Reporting: Filter and group data as needed for detailed financial analysis.
Conclusion
Creating a dynamic budgeting template in Excel enhances financial planning and decision-making. With real-time tracking and automated calculations, you can stay on top of your finances and adapt to changes more effectively.
Next Chapter Preview: In the next chapter, we’ll cover Sales Forecasting Techniques: Trend and Seasonal Analysis in Excel, where you’ll learn how to project sales using historical data and identify patterns through trend and seasonal analysis. Stay tuned!
Recommended Courses for you


Learn, Invest, and Grow with Kotak Videos
Explore our comprehensive video library that blends expert market insights with Kotak's innovative financial solutions to support your goals.

Trading with collateral as margin with Kotak Neo

How India is Redefining Space Exploration

