


Kotak
Stockshaala
Chapter 5 | 3 min read
Depreciation Calculations: Straight-Line vs. Declining Balance Methods in Excel
Depreciation is an essential accounting concept that allocates the cost of a tangible asset over its useful life. There are several methods for calculating depreciation, with the Straight-Line and Declining Balance methods being the most common. In this chapter, we will explore both depreciation methods and how to implement them in Excel to analyse asset value over time.
What is Depreciation?
Depreciation refers to the systematic reduction in the value of a fixed asset over its useful life due to wear and tear, obsolescence, or usage. It helps companies spread the cost of an asset over time, ensuring that financial statements accurately reflect the expense in the period in which the asset contributes to revenue generation.
Straight-Line Depreciation
The Straight-Line Method spreads the cost of an asset evenly across its useful life. This method is simple to use and is often applied when the asset’s benefit is assumed to be consistent over time.
The formula for Straight-Line Depreciation:
Depreciation Expense = (Cost of Asset - Salvage Value) / Useful Life (years)
Where,
- Cost of Asset: Initial purchase price.
- Salvage Value: Estimated residual value at the end of the asset’s useful life.
- Useful Life: Estimated number of years the asset will be in service.
Step-by-Step Guide: Calculating Straight-Line Depreciation in Excel
Example: A company purchases equipment for ₹50,000 with a salvage value of ₹5,000 and a useful life of 10 years.
1. Set Up the Data:
- Cost of Asset = ₹50,000
- Salvage Value = ₹5,000
- Useful Life = 10 years
Calculate Annual Depreciation:
=(₹50,000 - ₹5,000) / 10
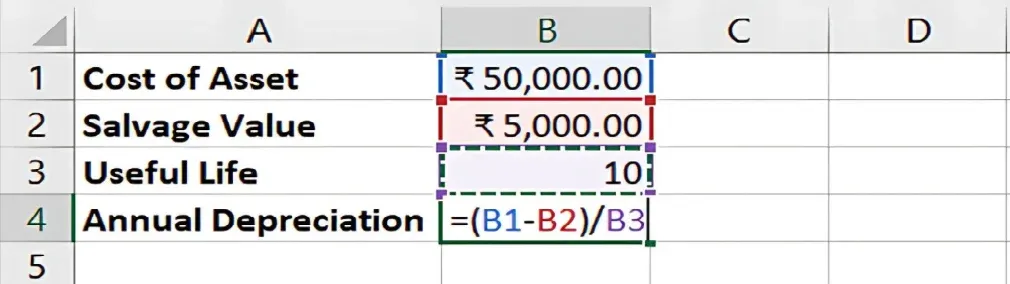
2. Result: The annual depreciation expense is ₹4,500.
3. Create a Depreciation Schedule: In Excel, list the years and apply the depreciation expense for each year. The asset's book value decreases by ₹4,500 annually until it reaches the salvage value of ₹5,000 at the end of year 10.
1 | ₹4,500 | ₹4,500 | ₹45,500 |
2 | ₹4,500 | ₹9,000 | ₹41,000 |
... | ... | ... | ... |
10 | ₹4,500 | ₹45,000 | ₹5,000 |
Declining Balance Method
The Declining Balance Method accelerates depreciation, allocating more expense in the early years of the asset’s life. It is useful for assets that lose value quickly or become obsolete early.
The formula for Declining Balance Depreciation:
Depreciation Expense = Book Value × 2 / Useful Life (years)
(For Double Declining Balance)
- Book Value: Initial asset cost minus accumulated depreciation.
Step-by-Step Guide: Calculating Declining Balance Depreciation in Excel
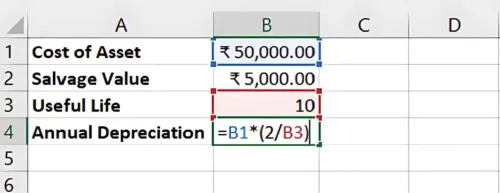
Example: The same equipment (₹50,000 cost, ₹5,000 salvage value, 10-year life) using the Double Declining Balance method.
- Set Up the Data:
- Cost of Asset = ₹50,000
- Salvage Value = ₹5,000
- Useful Life = 10 years
Calculate Depreciation for Year 1: =50,000 * (2/10)
-
Result: The depreciation expense for the first year is ₹10,000.
-
Calculate Depreciation for Subsequent Years: For subsequent years, the depreciation is applied to the new book value (original cost minus accumulated depreciation).
1 | ₹10,000 | ₹10,000 | ₹40,000 |
2 | ₹8,000 | ₹18,000 | ₹32,000 |
... | ... | ... | ... |
The declining balance method allocates more depreciation in the early years and less in later years, with the depreciation stopping once the book value reaches the salvage value.
Choosing Between Straight-Line and Declining Balance
- Straight-Line: Best for assets that provide equal benefits over time, such as buildings or office furniture.
- Declining Balance: Suitable for assets that lose value quickly or become obsolete, like technology equipment or vehicles.
Key Takeaways:
-
The Straight-Line Method is simple and evenly spreads the cost of an asset over its useful life.
-
The Declining Balance Method front-loads depreciation, reflecting higher early wear and tear or obsolescence.
-
Excel makes it easy to create detailed depreciation schedules for both methods.
Conclusion:
Understanding both the Straight-Line and Declining Balance methods of depreciation is essential for accurate financial modelling and accounting. Each method has its use case depending on the nature of the asset, and both can be easily implemented in Excel.
Next Chapter Preview: In the next chapter, we will revisit the concept of the time value of money and explore the use of the FV and PV functions for future and present value calculations. Stay tuned for detailed explanations of how to calculate both future and present values using Excel’s built-in functions!
Recommended Courses for you


Learn, Invest, and Grow with Kotak Videos
Explore our comprehensive video library that blends expert market insights with Kotak's innovative financial solutions to support your goals.

Trading with collateral as margin with Kotak Neo

How India is Redefining Space Exploration

