


Kotak
Stockshaala
Chapter 1 | 2 min read
Basics of Stock Market Data (OHLC, Volume, Indicators)
Before we ask AI to screen stocks, we need to understand the raw material it works with market data.
Every trade on NSE or BSE leaves behind a trail of numbers.
These numbers — price, volume, indicators — are not just statistics.
They’re signals that tell the story of what’s happening in the market.
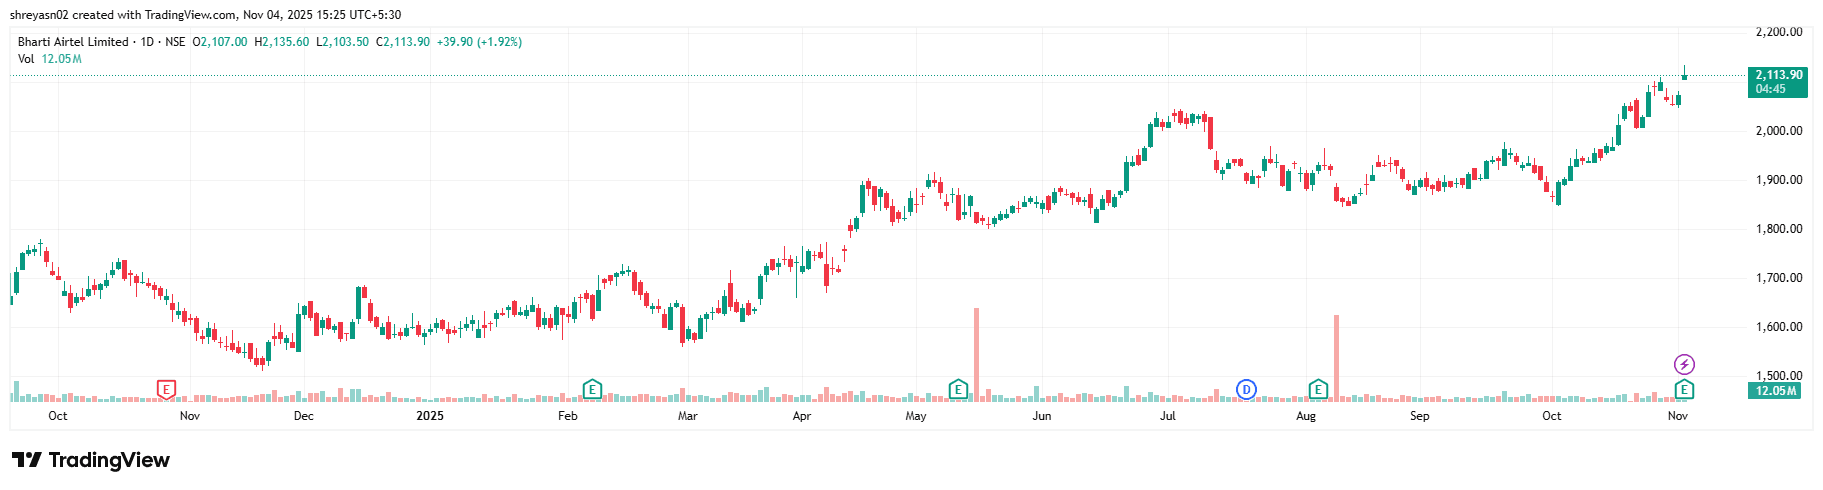
OHLC – The Building Block
Every trading day, a stock shows four important prices:
Open | Price at which the stock starts trading for the day |
High | The highest price reached during the day |
Low | The lowest price during the day |
Close | The price at market closing time |
This is called OHLC data. Most stock charts you see are built on these four numbers.
Example:
Infosys opens at ₹1,480, touches ₹1,500 (high), drops to ₹1,470 (low), and closes at ₹1,490.
This range tells you the market mood—was the stock strong, weak, or just moving sideways?
Volume – The Pulse of Trading
Price is important, but without volume, it doesn’t mean much.
- Volume is the number of shares traded during a period.
- High volume means strong participation. Low volume means fewer traders are active.
Example: If HDFC Bank rises 2% but on very low volume, the move might not be reliable. But the same rise with heavy trading volume shows real buying interest.
Indicators – Simplifying the Data
Indicators are formulas applied to price and volume to make trends clearer. Think of them as shortcuts to spot momentum, overbought/oversold zones, or trend direction.
Some commonly used ones in India:
- Moving Averages (MA): Smooths price data to show the overall trend.
- Relative Strength Index (RSI): Tells if a stock is overbought (>70) or oversold (<30).
- MACD (Moving Average Convergence Divergence): Helps track momentum shifts.
How to Try This Yourself
-
Open NSE/BSE website → pick any liquid stock.
-
Look at the OHLC chart:
- Check if the “close” price is higher than the “open.”
- Spot the high and low to see how volatile the day was.
- Add volume to the chart:
- If price goes up on high volume, it shows conviction.
- If price moves with low volume, treat it with caution.
- Apply an indicator:
- Try RSI (if above 70 → overbought, if below 30 → oversold).
- Or check the 200-day moving average to see long-term trend.
By doing this once or twice, you’ll see how the raw numbers (OHLC, volume) feed into the indicators that AI and screeners use later.
Why This Matters for AI Screening
When you use AI for screening, you’ll often type conditions like:
- “Find stocks above their 200-day moving average.”
- “Show me companies with RSI below 30.”
To understand and use these queries, you must know what OHLC, volume, and indicators represent. Without this foundation, AI results will look like random numbers.
Final Takeaway
Market data is the language of stocks.
OHLC shows price behaviour, volume reveals conviction, and indicators simplify trends into signals you can act on.
Once you understand these basics, you can guide AI with smarter prompts — whether it’s spotting momentum, gauging strength, or filtering for bargain entries.
Disclaimer: This article is for informational purposes only and does not constitute financial advice. It is not produced by the desk of the Kotak Neo Research Team, nor is it a report published by the Kotak Neo Research Team. The information presented is compiled from several secondary sources available on the internet and may change over time. Investors should conduct their own research and consult with financial professionals before making any investment decisions. Read the full disclaimer here.
Investments in securities market are subject to market risks, read all the related documents carefully before investing. Brokerage will not exceed SEBI prescribed limit. The securities are quoted as an example and not as a recommendation. SEBI Registration No-INZ000200137 Member Id NSE-08081; BSE-673; MSE-1024, MCX-56285, NCDEX-1262.
Recommended Courses for you


Learn, Invest, and Grow with Kotak Videos
Explore our comprehensive video library that blends expert market insights with Kotak's innovative financial solutions to support your goals.

Trading with collateral as margin with Kotak Neo

How India is Redefining Space Exploration

