


Kotak
Stockshaala
Chapter 1 | 2 min read
Return on Investment (ROI) Calculation Using Excel
Return on Investment (ROI) is one of the most important metrics for evaluating the profitability of an investment. Whether you're investing in a project, stock, or business, ROI provides insight into how much profit you've made relative to the cost of the investment. Using Excel for ROI calculation not only simplifies the process but also allows you to test multiple scenarios and make informed decisions.
What is ROI?
Return on Investment (ROI) is a performance measure used to evaluate the efficiency or profitability of an investment. It’s calculated as a percentage that compares the gain (or loss) from an investment relative to its cost.
ROI Formula:
ROI = (Net Profit / Investment Cost) × 100
Where:
- Net Profit = Total revenue from the investment minus total costs.
- Investment Cost = The initial cost of the investment.
A positive ROI indicates that the investment has made a profit, while a negative ROI indicates a loss.
Why is ROI Important?
ROI helps you:
- Compare Investments: Evaluate which investment yields the highest returns.
- Track Performance: Assess how well your current investments are performing.
- Make Informed Decisions: Prioritise investments that offer better returns.
Step-by-Step Guide: ROI Calculation in Excel
Step 1: Input Data
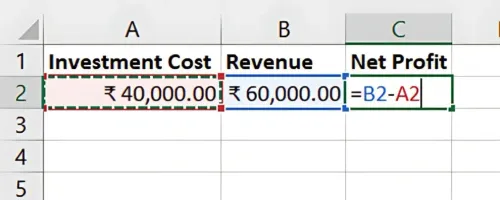
Suppose you invested ₹40,000 in a project, and after one year, it generated ₹60,000 in revenue. The net profit is:
Net Profit = Revenue - Investment Cost
₹40,000 | ₹60,000 | ₹20,000 |
Step 2: Calculate ROI in Excel
In Excel, use the following formula to calculate ROI:
=(Net Profit / Investment Cost) * 100
For the example above:
=(20000 / 40000) * 100
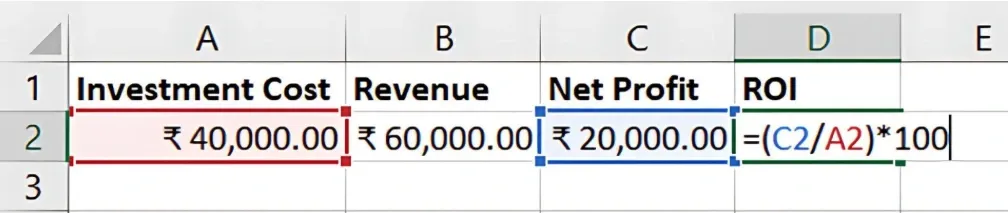
Result: The ROI is 50%.
Step 3: Comparing Multiple Investments
You can calculate and compare the ROI of different investments to see which one offers the best return. For example:
Project A | ₹40,000 | ₹60,000 | ₹20,000 | 50% |
Project B | ₹50,000 | ₹65,000 | ₹15,000 | 30% |
Project C | ₹30,000 | ₹45,000 | ₹15,000 | 50% |
By adding input variables of cost and revenue, then dragging the formulas, we get the following in Excel:
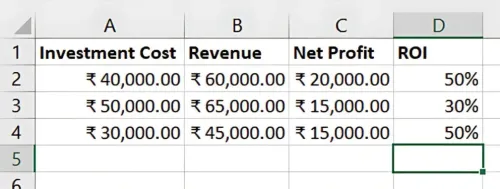
In this case, both Project A and Project C have the same ROI of 50%, but you may choose one based on other factors like risk or capital availability.
Benefits of Excel for ROI Calculations
- Automated Calculations: Excel quickly calculates ROI across multiple investments.
- Scenario Analysis: You can adjust the cost or profit figures to test how changes affect the ROI.
- Comparison: Compare various investment opportunities easily.
Key Takeaways:
- ROI measures the profitability of an investment relative to its cost.
- Excel simplifies ROI calculations, making it easier to evaluate multiple investment scenarios.
- Use Excel to quickly assess and compare investment performance for informed decision-making.
Conclusion:
Calculating ROI is crucial for making investment decisions. With Excel, you can easily compute ROI and compare different opportunities to determine which one provides the best returns. Excel’s functionality also allows you to test various financial scenarios, helping you plan effectively.
Next Chapter Preview: In the next chapter, we will explore Calculating Profitability Ratios: Gross Profit Margin and net Profit Margin using Excel. These ratios provide deeper insights into the financial health of a business by analysing its profitability. Stay tuned for more advanced financial calculations!
Recommended Courses for you


Learn, Invest, and Grow with Kotak Videos
Explore our comprehensive video library that blends expert market insights with Kotak's innovative financial solutions to support your goals.

Trading with collateral as margin with Kotak Neo

How India is Redefining Space Exploration

