


Kotak
Stockshaala
Chapter 2 | 2 min read
Calculating Profitability Ratios: Gross Profit Margin, Net Profit Margin
Profitability ratios are essential for assessing the financial health of a business. They reveal how efficiently a company is generating profit relative to its revenue and costs. In this chapter, we’ll focus on two key profitability ratios: Gross Profit Margin and Net Profit Margin, and how to calculate them using Excel.
What Are Profitability Ratios?
Profitability ratios measure a company’s ability to generate profit from its operations. They help investors and management assess the efficiency of a company in turning revenue into profit.
Gross Profit Margin
The Gross Profit Margin indicates how much profit a company makes from its revenue after accounting for the cost of goods sold (COGS). It shows the percentage of revenue that exceeds the COGS, reflecting the basic profitability of the core business activities.
Formula for Gross Profit Margin:
Gross Profit Margin = (Gross Profit / Revenue) × 100
Where:
- Gross Profit = Revenue - COGS
- Revenue = Total sales or income from operations
Step-by-Step Guide: Calculating Gross Profit Margin in Excel
Step 1: Input Data
Assume the following data for a company:
- Revenue = ₹500,000
- COGS = ₹300,000
Calculate Gross Profit:
Gross Profit = Revenue - COGS
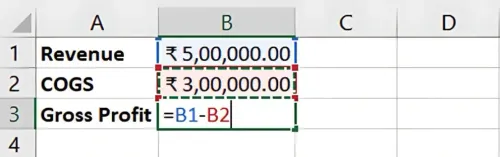
Result: Gross Profit = ₹200,000
Step 2: Calculate Gross Profit Margin in Excel
In Excel, apply the following formula:
=(Gross Profit / Revenue) * 100
For this example:
=(200000 / 500000) * 100
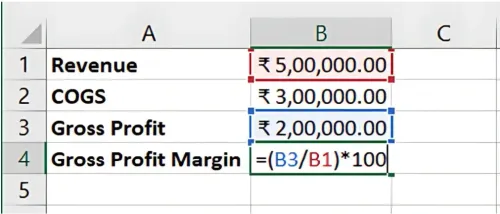
Result: The Gross Profit Margin is 40%.
Net Profit Margin
The Net Profit Margin is a more comprehensive measure of profitability as it accounts for all expenses, including operating expenses, taxes, and interest. It shows the percentage of revenue left after all costs have been deducted.
Formula for Net Profit Margin:
Net Profit Margin = (Net Profit / Revenue) × 100
Where:
- Net Profit = Total revenue minus all expenses (including taxes, interest, and operating expenses).
Step-by-Step Guide: Calculating Net Profit Margin in Excel
Step 1: Input Data
Let’s assume the company has the following additional data:
- Operating expenses = ₹100,000
- Taxes and interest = ₹30,000
Net Profit is calculated as:
Net Profit = Revenue - (COGS + Operating Expenses + Taxes and Interest)
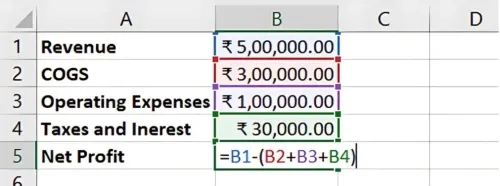
Result: Net Profit = ₹70,000
Step 2: Calculate Net Profit Margin in Excel
In Excel, apply the following formula:
=(Net Profit / Revenue) * 100
For this example:
=(70000 / 500000) * 100
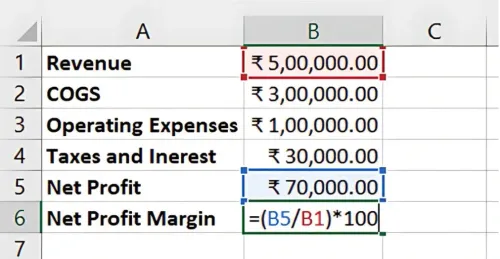
Result: The Net Profit Margin is 14%.
Benefits of Using Excel for Profitability Ratios
- Automation: Excel quickly calculates key profitability ratios from basic data inputs.
- Comparison: You can compare profitability across different time periods or business units.
- Financial Analysis: Gross and Net Profit Margins give a clear picture of the company's efficiency and financial health.
Key Takeaways:
- Gross Profit Margin measures the basic profitability of the company's core activities.
- Net Profit Margin gives a more complete picture by accounting for all costs.
- Using Excel for these calculations helps automate the process and provides accurate results for decision-making.
Conclusion:
Calculating Gross Profit Margin and Net Profit Margin is critical for evaluating a company’s profitability. These ratios provide a clear view of financial health and efficiency. With Excel, you can easily calculate and track these ratios over time to assess performance.
Next Chapter Preview: In the next chapter, we’ll explore Liquidity Ratios such as the Current Ratio and Quick Ratio, helping you analyse a company’s short-term financial health and ability to meet its obligations. Stay tuned for more in-depth financial analysis!
Recommended Courses for you


Learn, Invest, and Grow with Kotak Videos
Explore our comprehensive video library that blends expert market insights with Kotak's innovative financial solutions to support your goals.

Trading with collateral as margin with Kotak Neo

How India is Redefining Space Exploration

