


Kotak
Stockshaala
Chapter 8 | 3 min read
Discounted Cash Flow (DCF) Analysis: Excel Setup
Discounted Cash Flow (DCF) analysis is a popular valuation method used to estimate the intrinsic value of an investment, business, or asset. By discounting future cash flows to their present value, DCF helps investors assess whether an asset is undervalued or overvalued based on its expected returns. This analysis is especially useful for long-term investment decisions, as it accounts for the time value of money.
In this blog, we’ll guide you through setting up a DCF model in Excel, making it easier for you to perform an in-depth valuation analysis.
What is DCF Analysis?
Discounted Cash Flow (DCF) Analysis involves projecting future cash flows of an asset or business and discounting them back to their present value using a discount rate. The sum of these present values gives the intrinsic value of the asset.
The formula for DCF:
DCF = ∑(t=1)n [Ct / (1 + r)t]
Where:
- C = Cash flow at time t
- r = Discount rate (required rate of return)
- n = Number of periods (years)
Why Use DCF Analysis?
-
Valuation of Investments: DCF helps determine the true value of an investment, allowing investors to make more informed decisions.
-
Mergers and Acquisitions: It is often used to evaluate companies during mergers and acquisitions to assess their future earning potential.
-
Project Feasibility: DCF analysis is also useful in assessing the feasibility of long-term projects and capital budgeting decisions.
Step-by-Step Guide: Setting Up DCF in Excel
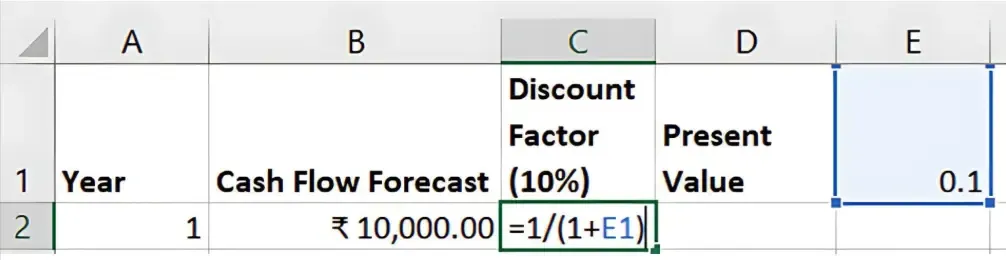
Step 1: Set Up the Cash Flow Forecast
- Create Columns:
- Column A: Year (1, 2, 3, ...)
- Column B: Cash Flow Forecast (e.g., ₹10,000, ₹12,000, ₹14,000, ...)
- Enter Cash Flows:
- Forecast the free cash flows (after expenses, taxes, and investments) for each year.
Step 2: Choose a Discount Rate
The discount rate reflects the risk of the investment. It can be the Weighted Average Cost of Capital (WACC) for companies or the required rate of return for individual investments. Enter this rate in a separate cell, such as 0.10 for 10%.
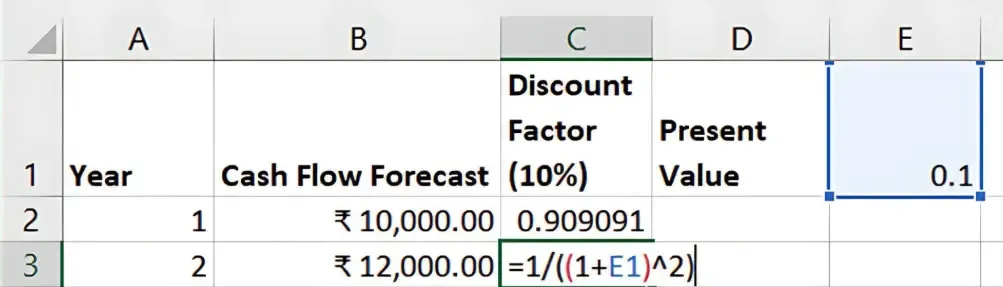
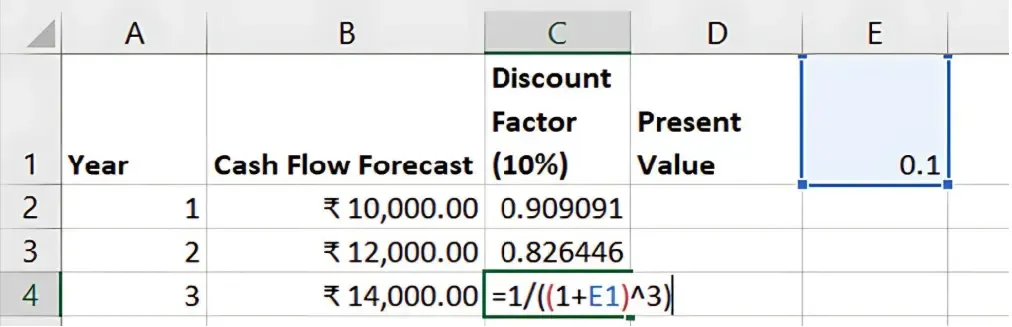
Step 3: Calculate the Present Value of Cash Flows
- Use the NPV Formula:
- In a separate cell, use the NPV function to discount the cash flows:
=NPV(discount_rate, B2:B6)
-
Discount_rate is the cell reference for the chosen discount rate.
- B2:B6 is the range of cash flows for each year.
-
Adjust for Initial Investment:
- Subtract the initial investment or cash outflow from the NPV result to get the final DCF value:
=NPV(discount_rate, B2:B6) - Initial_Investment
Step 4: Calculate the Terminal Value
In most cases, investments or businesses have value beyond the forecasted period. To account for this, calculate the Terminal Value using the Gordon Growth Model:
Terminal Value = C(n+1) / (r - g)
Where:
- C(n+1) = Cash flow in the year after the forecast period
- r = Discount rate
- g = Growth rate of cash flows
Add the discounted terminal value to the NPV of forecasted cash flows for a complete DCF valuation. Example of a DCF Model
Example of a DCF Model
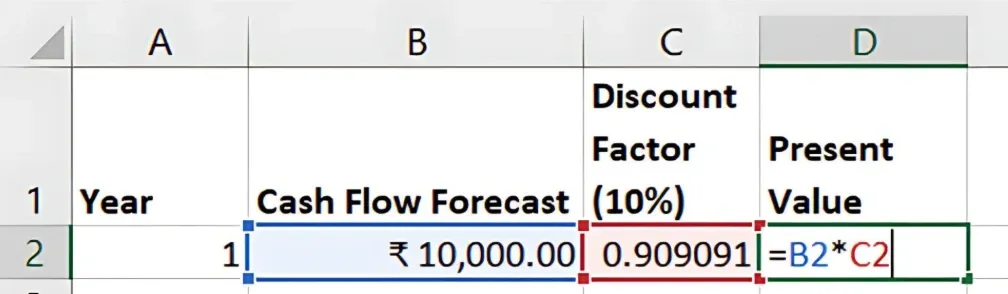
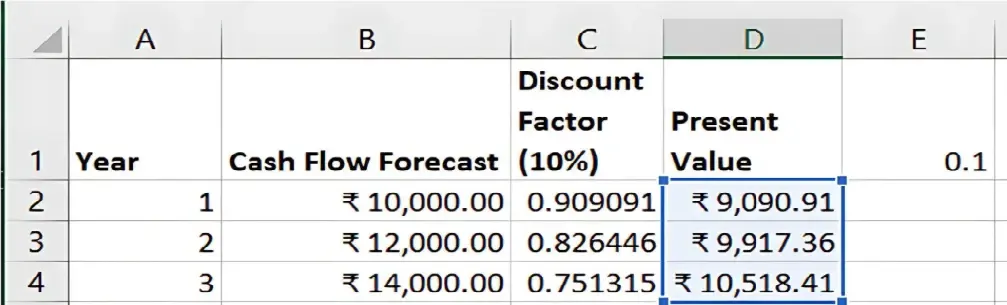
1 | ₹10,000 | 0.909 | ₹9,090 |
2 | ₹12,000 | 0.826 | ₹9,912 |
3 | ₹14,000 | 0.751 | ₹10,514 |
... | ... | ... | ... |
Total PV | ₹29,516 |
Benefits of DCF Analysis
-
Accurate Valuation: DCF provides a detailed assessment of an asset’s intrinsic value by considering future cash flows.
-
Customisable: Adjusting the discount rate and cash flow projections allows for different scenarios to be evaluated.
-
Time Value of Money: DCF accounts for the time value of money, providing a realistic measure of an investment’s worth.
Key Takeaways:
- DCF analysis helps in valuing investments based on future cash flow projections.
- Use the NPV function in Excel to calculate the present value of cash flows.
- Including a terminal value ensures a more comprehensive valuation.
Conclusion:
DCF analysis is a powerful method for determining the intrinsic value of investments. With Excel, you can easily set up a DCF model and adjust variables to make informed financial decisions.
Next Chapter Preview: In the next chapter, we will explore Break-Even Point Calculation for Businesses, covering how to determine the point at which total revenues equal total costs and how to set up a break-even analysis in Excel. Stay tuned for a detailed guide to assess your business's profitability!
Recommended Courses for you


Learn, Invest, and Grow with Kotak Videos
Explore our comprehensive video library that blends expert market insights with Kotak's innovative financial solutions to support your goals.

Trading with collateral as margin with Kotak Neo

How India is Redefining Space Exploration

