


Kotak
Stockshaala
Chapter 8 | 2 min read
Analysing Stock Performance Using Moving Averages
Moving averages are essential tools for analysing stock trends, and smoothing out price data to help investors identify trends and potential buy or sell signals. Using Excel, investors can calculate and visualise various types of moving averages—such as simple moving averages (SMA) and exponential moving averages (EMA)—to make informed decisions based on stock performance trends.
Why Use Moving Averages?
-
Trend Identification: Moving averages help identify upward, downward, or sideways trends.
-
Entry/Exit Signals: Crossovers of shorter and longer moving averages often signal buying or selling points.
-
Volatility Reduction: They smooth out price fluctuations, providing a clearer view of trends.
Types of Moving Averages
-
Simple Moving Average (SMA): Average price over a specific period.
-
Exponential Moving Average (EMA): Averages prices with more weight on recent data, making it more responsive to recent price changes.
Step-by-Step Guide to Calculating Moving Averages in Excel
Step 1: Set Up Price Data Suppose you have historical daily closing prices for a stock:
Jan 1 | ₹100 |
Jan 2 | ₹102 |
Jan 3 | ₹104 |
... | ... |
Step 2: Calculate the Simple Moving Average (SMA)
To calculate a 5-day SMA:
In the cell below the fifth price, use the formula: =AVERAGE(B2:B6)
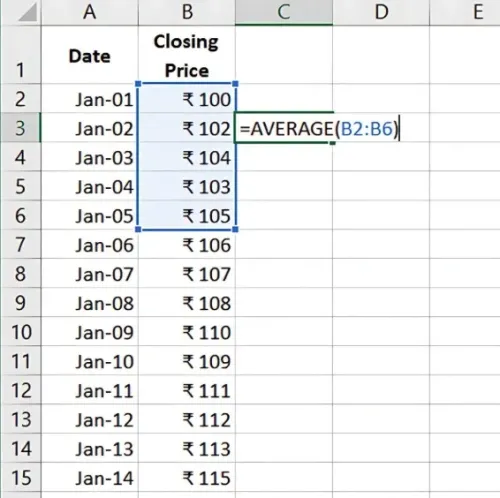
- Drag this formula down the column to calculate the 5-day SMA for the rest of the data.
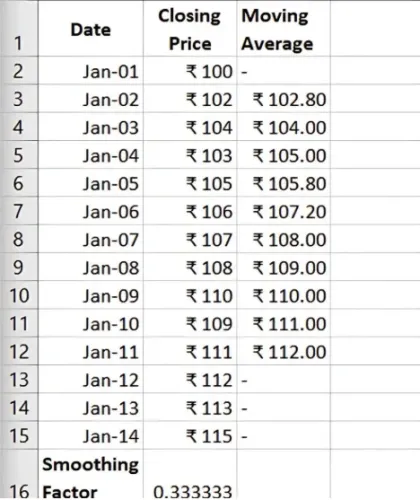
This provides a 5-day moving average that helps track short-term trends.
Step 3: Calculate the Exponential Moving Average (EMA)
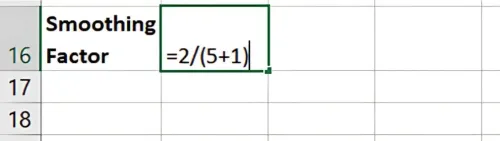
The EMA calculation requires a smoothing factor, which can be calculated as:
Smoothing Factor = 2 / (N + 1)
Where N is the number of periods (e.g., 5 days for a 5-day EMA).
To calculate EMA in Excel:
- Set the initial EMA as the first SMA (e.g., 5-day SMA).
Use the formula for subsequent values:
= (Closing Price * Smoothing Factor) + (Previous EMA * (1 - Smoothing Factor))
For the first EMA value (let's assume Jan-05 as the starting point), you can use the Simple Moving Average (SMA) as the initial EMA.
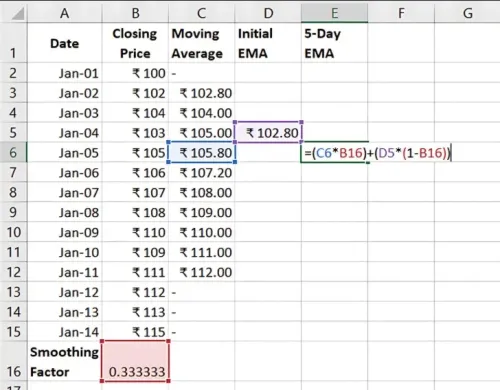
- Apply this formula down the column to calculate the EMA.
Using Moving Averages for Stock Analysis
-
Trend Confirmation: A rising SMA or EMA indicates an uptrend, while a declining one suggests a downtrend.
-
Crossover Signals: When a short-term MA crosses above a long-term MA, it may signal a buying opportunity (and vice versa).
-
Support/Resistance Levels: MAs can act as support in uptrends and resistance in downtrends.
Benefits of Using Moving Averages in Excel
-
Customisable Periods: Adjust the number of days to reflect short- or long-term trends.
-
Flexible Analysis: Apply MAs to various time frames (daily, weekly) to suit investment goals.
-
Visual Clarity: Excel’s charting options allow you to plot MAs over price data for visual trend analysis.
Key Takeaways:
- SMA and EMA smooth out price fluctuations, aiding in trend identification.
- Crossovers and moving averages help determine entry and exit points.
- Excel allows for flexible moving average calculations and easy visualisation.
Conclusion
Using moving averages in Excel helps investors track trends, reduce volatility noise, and make informed stock decisions. By combining SMA and EMA, investors can create a comprehensive view of stock performance.
Next Chapter Preview: In the next chapter, we’ll cover Bond Price Calculation Using Excel. This involves determining bond value based on factors like coupon payments, maturity, and interest rates, providing insight into bond investment valuations. Stay tuned!
Recommended Courses for you


Learn, Invest, and Grow with Kotak Videos
Explore our comprehensive video library that blends expert market insights with Kotak's innovative financial solutions to support your goals.

Trading with collateral as margin with Kotak Neo

How India is Redefining Space Exploration

