

Kotak
Stockshaala
Chapter 2 | 3 min read
RSI Momentum Continuation Scalping
Most traders are taught to sell when RSI goes above 70, treating it as overbought. In a strong intraday trend, that instinct is a trap. It puts you short against a market that is accelerating. The scalper flips the logic entirely and uses a fast RSI to confirm that momentum is continuing, not ending.
This is the RSI Momentum Continuation Scalp. It reads a momentum burst inside an existing trend and rides it for a few points, using RSI as a green light rather than a stop sign.
The Setup
RSI, the Relative Strength Index, measures the speed and size of recent price moves on a scale of 0 to 100.
For scalping, we use a fast setting, a 7 or 9-period RSI, so it responds quickly on the 3 or 5-minute chart.
The Swing Trading course covers RSI in depth if you want the full grounding; here we use it purely as a momentum gauge.
The zones are what matter. RSI holding above 60 signals genuine bullish momentum. RSI below 40 signals bearish momentum.
These are not overbought or oversold lines. They are momentum thresholds. When RSI sustains above 60 during an uptrend, the move has real force behind it.
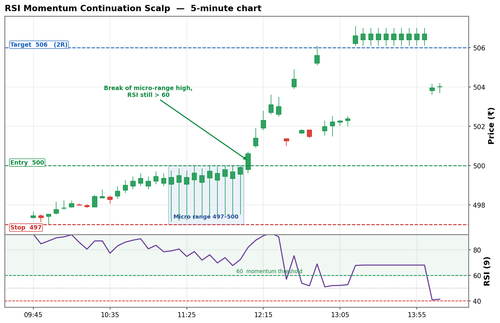
Entry (long): RSI sustaining above 60 while price breaks the high of a small consolidation, a micro range, within the trend. Enter on that break.
Stop: at the micro range low.
Exit: when RSI drops below 50, showing momentum is fading, or when price closes back inside the micro range, whichever comes first.
The Analogy
Think of a boy flying a kite from a terrace when a strong gust arrives. He does not start winding the string in while the kite is still climbing. He lets the line run out through his fingers and gives the kite room to take the wind. RSI above 60 is that gust. You do not fight a kite that is rising. You let the line run and only reel it back once the wind eases and the kite begins to sag.

A Worked Example
This example uses: entry ₹500, account capital ₹5,00,000, 1% risk per trade (₹5,000). The stop distance varies by setup.
A stock is trending up on the 5-minute chart. A fast RSI holds above 60 while price coils into a tight micro range between ₹497 and ₹500.
Step | Level (₹) | Detail |
|---|---|---|
Trend and momentum check | - | Uptrend intact, RSI (9) sustaining above 60 |
Micro range | 497 to 500 | Tight consolidation inside the trend |
Entry (break of micro range high) | 500 | RSI still above 60 as price breaks ₹500 |
Stop (micro range low) | 497 | Risk = ₹3 per share |
Position size | 1,666 shares | ₹5,000 / ₹3 |
Target (2R fixed scalp) | 506 | Reward = ₹6 per share, R-multiple = 2.0R |
Exit signal | - | RSI drops below 50, or price closes back inside range |
Common Mistakes
Mistake 1: Shorting the trend because RSI looks high
An RSI at 68 in a strong uptrend is confirmation, not a reversal signal. Fading it puts you against a moving market. In this setup, high RSI is exactly what you want to see before going long.
Mistake 2: Holding after RSI drops below 50
The exit is mechanical. Once RSI falls under 50, the momentum that justified the trade is gone. Holding on hope turns a clean scalp into a slow bleed. Respect the exit signal.
Key Takeaways
- The RSI Momentum Continuation Scalp uses a fast RSI (7 or 9) above 60 to confirm bullish momentum is continuing inside an existing trend.
- Entry is the break of a micro range high while RSI holds above 60. Stop goes at the micro range low.
- Exit when RSI drops below 50 or price closes back inside the micro range. The 60 and 40 zones are momentum thresholds, not overbought or oversold lines.
Assignment
- On a 5-minute chart of a trending stock, add a 9-period RSI.
- Find two moments where RSI held above 60 and price broke a small consolidation high. Measure how far price travelled before RSI dropped below 50.
- Compare that to what a fixed 2R target would have captured.
Which exit, the RSI signal or the fixed target, would have served you better on each? Record your findings.
In the next chapter, we add one of the most watched intraday levels of all. The VWAP Quick Reclaim Scalp trades the moment price loses the volume-weighted average price and snaps back above it with force.
Disclaimer: This article is for informational purposes only and does not constitute financial advice. It is not produced by the desk of the Kotak Neo Research Team, nor is it a report published by the Kotak Neo Research Team. The information presented is compiled from several secondary sources available on the internet and may change over time. Investors should conduct their own research and consult with financial professionals before making any investment decisions. Read the full disclaimer here.
Investments in securities market are subject to market risks, read all the related documents carefully before investing. Brokerage will not exceed SEBI prescribed limit. The securities are quoted as an example and not as a recommendation. SEBI Registration No-INZ000200137 Member Id NSE-08081; BSE-673; MSE-1024, MCX-56285, NCDEX-1262.
Recommended Courses for you



















Learn, Invest, and Grow with Kotak Videos
Explore our comprehensive video library that blends expert market insights with Kotak's innovative financial solutions to support your goals.

Trading with collateral as margin with Kotak Neo

How India is Redefining Space Exploration

