

Kotak
Stockshaala
Chapter 1 | 3 min read
EMA Pullback Scalping
A stock has been climbing steadily all morning on the 3-minute chart. Every few candles it dips slightly, touches a rising average, and pushes higher again. Each of those shallow dips was a clean entry. The trend did the work. All the scalper had to do was wait for the pause and step in as it ended.
This is the EMA Pullback Scalp, the most dependable trend-based scalping setup. It does one thing: it enters a brief pullback inside a strong intraday trend and rides the resumption for a few points.
The Setup
Two exponential moving averages do the work here: the 9 EMA and the 20 EMA.
An EMA gives more weight to recent prices, so it hugs the action closely, which is exactly what a scalper needs on a fast chart.
When the 9 EMA sits above the 20 EMA and both slope up, the short-term trend is up.
The zone between the two averages becomes your pullback area.
Use the setup only when the trend is strong and obvious on the 3 or 5-minute chart. In a strong intraday trend, price pulls back shallowly into the 9/20 zone, pauses, and resumes. You are trading that resumption, not guessing at a turn.
Entry: wait for a pullback candle to reject the 9/20 zone, then enter when the next candle breaks that rejection candle's high, with a visible pickup in volume. The volume pickup is what separates a real resumption from a drift.
Stop: just below the pullback's micro swing low.
Exit: a fixed scalp target, typically 2R, or a candle closing back below the 9 EMA, whichever comes first.
The Analogy
Picture a group of children turning a long skipping rope on a quiet street. The child waiting to join does not leap in at random. She watches the rope, waits for the predictable moment it sweeps low near the ground, and steps in cleanly as it begins to rise again.
The pullback into the 9/20 zone is that low sweep. The rope has not stopped turning, it has only come down for a moment, and the instant it lifts again is your entry.

A Worked Example
This example uses: entry ₹500, account capital ₹5,00,000, 1% risk per trade (₹5,000). The stop-loss distance varies by setup.
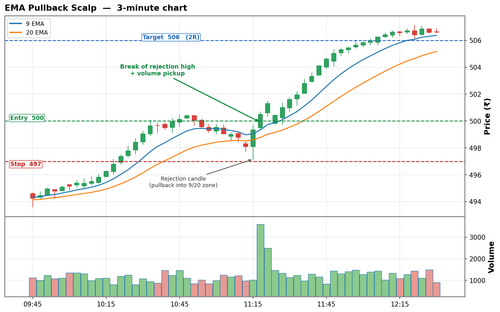
A stock is in a clear uptrend on the 3-minute chart, with the 9 EMA above the 20 EMA and both rising. Price pulls back into the zone and forms a rejection candle.
Step | Level (₹) | Detail |
|---|---|---|
Trend check | - | 9 EMA above 20 EMA, both rising on 3-min chart |
Pullback into 9/20 zone | 497 to 499 | Shallow dip, rejection candle forms at ₹498 |
Entry (break of rejection high, volume up) | 500 | Next candle breaks rejection high with volume pickup |
Stop (below pullback micro swing low) | 497 | Risk = ₹3 per share |
Position size | 1,666 shares | ₹5,000 / ₹3 |
Target (2R fixed scalp) | 506 | Reward = ₹6 per share, R-multiple = 2.0R |
Alternative exit | - | Candle closes back below 9 EMA before target |
Common Mistakes
Mistake 1: Entering the pullback without waiting for the break and volume
Buying while price is still dipping into the zone is catching a falling knife. The trade is only valid once the next candle breaks the rejection high with a volume pickup. That break is the proof the trend is resuming.
Mistake 2: Trading pullbacks that are too deep
If price slices straight through the 20 EMA and keeps going, that is not a shallow pullback, it is a trend losing strength. A valid scalp pullback is shallow and brief. Deep pullbacks are a signal to stand aside.
Key Takeaways
- The EMA Pullback Scalp enters a shallow dip into the 9/20 EMA zone in a strong intraday trend, on the 3 or 5-minute chart.
- Entry is the break of the rejection candle's high with a volume pickup, never the dip itself. Stop goes below the pullback micro swing low.
- Exit at a fixed scalp target, typically 2R, or on a candle closing back below the 9 EMA, whichever comes first.
Assignment
- On a 3-minute chart of any liquid stock in a clearly trending session, mark the 9 and 20 EMA. Find three shallow pullbacks into the zone.
- For each, check whether the next candle broke the rejection high with a volume pickup, and measure how many points the resumption delivered before stalling.
Would a 2R target have been hit each time? Record your findings.
In the next chapter, we stay with the trend but swap the tool. The RSI Momentum Continuation Scalp uses a fast RSI to confirm that a momentum burst inside an existing trend has more room to run.
Disclaimer: This article is for informational purposes only and does not constitute financial advice. It is not produced by the desk of the Kotak Neo Research Team, nor is it a report published by the Kotak Neo Research Team. The information presented is compiled from several secondary sources available on the internet and may change over time. Investors should conduct their own research and consult with financial professionals before making any investment decisions. Read the full disclaimer here.
Investments in securities market are subject to market risks, read all the related documents carefully before investing. Brokerage will not exceed SEBI prescribed limit. The securities are quoted as an example and not as a recommendation. SEBI Registration No-INZ000200137 Member Id NSE-08081; BSE-673; MSE-1024, MCX-56285, NCDEX-1262.
Recommended Courses for you



















Learn, Invest, and Grow with Kotak Videos
Explore our comprehensive video library that blends expert market insights with Kotak's innovative financial solutions to support your goals.

Trading with collateral as margin with Kotak Neo

How India is Redefining Space Exploration

