

Kotak
Stockshaala
Chapter 1 | 3 min read
EMA Breakout Scalping
The moving averages had knotted together into a tight tangle, and price was going nowhere, coiling in a narrow band. The chart looked dead. Then one decisive candle punched away from the cluster on a surge of volume, and the quiet snapped into a fast, clean move. The traders who recognised the coil were positioned for the release. Everyone else noticed only after it had gone.
This is the EMA Breakout Scalp. It trades the expansion that follows compression, when price breaks decisively away from a cluster of moving averages.
The Setup
When a market goes quiet, the 9 and 20 EMA drift together and flatten, clustering into a tight zone.
This compression signals that volatility has contracted and energy is building. It is the calm before the move.
Compression alone does not tell you direction; it tells you a decisive move is coming.
The trigger: a strong candle that closes decisively away from the EMA cluster, accompanied by a clear expansion in volume.
The volume expansion is essential. A break away from the cluster without volume is likely to fail and fall back in. With volume, the expansion has genuine participation behind it.
Entry: on that decisive breakout candle.
Stop: inside the compression zone, because if price falls back into the cluster the breakout has failed.
Exit: a fixed scalp target, or leave on the first candle that shows a clear loss of momentum, such as a strong candle against your position.
The Analogy
Think of a canal sluice gate before it is lifted. For a long while nothing happens. The water simply piles up behind the gate, flat and silent, giving no hint of the force it holds. Then the gate lifts and the whole channel surges through at once. EMA compression is that silent build-up. The breakout candle with volume is the gate lifting. You cannot know the exact moment it will happen, but you can recognise the stored pressure and be ready for the release.

A Worked Example
This example uses: entry ₹500, account capital ₹5,00,000, 1% risk per trade (₹5,000). The stop distance varies by setup.
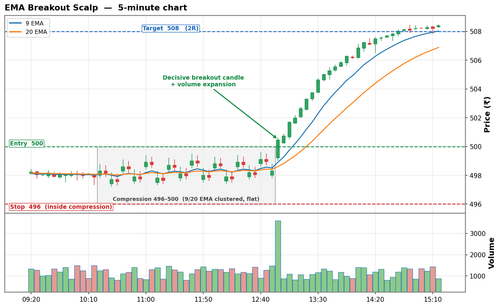
The 9 and 20 EMA have clustered tightly between ₹496 and ₹500. A decisive candle breaks upward out of the cluster on expanding volume.
Step | Level (₹) | Detail |
|---|---|---|
Compression zone | 496 to 500 | 9 and 20 EMA clustered tight, low volatility |
Breakout candle | closes at 500 | Strong close away from the cluster |
Volume | - | Clear volume expansion on the breakout candle |
Entry (breakout candle) | 500 | Enter on the decisive close above the cluster |
Stop (inside compression zone) | 496 | Risk = ₹4 per share |
Position size | 1,250 shares | ₹5,000 / ₹4 |
Target (2R fixed scalp) | 508 | Reward = ₹8 per share, R-multiple = 2.0R |
Alternative exit | - | First strong candle against the position |
Common Mistakes
Mistake 1: Taking the breakout without volume expansion
A break away from the EMA cluster on flat volume is the classic false breakout. Volume expansion is what confirms real participation. Without it, price tends to drift back into the cluster and stop you out.
Mistake 2: Placing the stop too far from the cluster
The whole premise is that a return into the compression zone kills the trade. The stop belongs just inside the cluster, keeping risk tight. A distant stop defeats the setup and turns a clean scalp into an oversized loss.
Key Takeaways
- The EMA Breakout Scalp trades expansion out of compression when the 9 and 20 EMA cluster tightly and price then breaks away decisively.
- The breakout candle must close strongly away from the cluster with clear volume expansion. Enter on that candle; stop goes inside the compression zone.
- Exit at a fixed scalp target or on the first candle showing a clear loss of momentum.
Assignment
- On a 5-minute chart, find two instances where the 9 and 20 EMA clustered tightly and flattened.
- For each, note the breakout candle and whether volume expanded clearly.
- Measure how far price travelled out of the cluster before stalling.
Compare a breakout that had strong volume with one that did not, and see how differently they resolved. Record your findings.
In the next chapter, we trade the mirror image of a breakout. The Key Level Rejection Scalp fades the breakouts that fail, entering as price is rejected at an obvious level and snaps back.
Disclaimer: This article is for informational purposes only and does not constitute financial advice. It is not produced by the desk of the Kotak Neo Research Team, nor is it a report published by the Kotak Neo Research Team. The information presented is compiled from several secondary sources available on the internet and may change over time. Investors should conduct their own research and consult with financial professionals before making any investment decisions. Read the full disclaimer here.
Investments in securities market are subject to market risks, read all the related documents carefully before investing. Brokerage will not exceed SEBI prescribed limit. The securities are quoted as an example and not as a recommendation. SEBI Registration No-INZ000200137 Member Id NSE-08081; BSE-673; MSE-1024, MCX-56285, NCDEX-1262.
Recommended Courses for you















Learn, Invest, and Grow with Kotak Videos
Explore our comprehensive video library that blends expert market insights with Kotak's innovative financial solutions to support your goals.

Trading with collateral as margin with Kotak Neo

How India is Redefining Space Exploration