

Kotak
Stockshaala
Chapter 3 | 3 min read
Index vs Stock Breakout Scalping
A stock broke above its intraday base, and on its own that break looked ordinary, the kind that fails half the time. But at that exact moment Nifty was breaking its own level in the same direction, with the whole market lifting together. The stock break was not alone, it had the index behind it. That alignment is what turns an average breakout into a high-probability one.
This is the Index vs Stock Breakout Scalp, the capstone setup of the course. It trades a stock breakout only when the index confirms, using correlation as a filter.
The Setup
Individual stocks do not move in isolation. Most large stocks move with their index, Nifty or Bank Nifty.
When the index is breaking a level and lifting, it drags its heavier constituents with it.
This setup uses that relationship: you trade a stock breakout only when the index breaks in the same direction at the same time. The index is your confirmation filter.
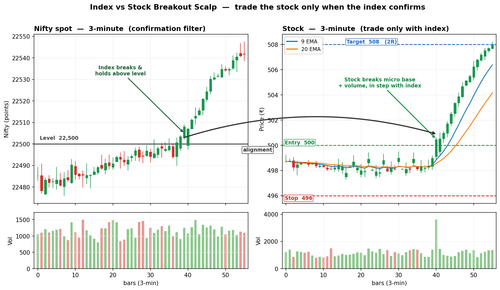
You watch two charts: the Nifty or Bank Nifty spot, and your chosen stock, both with the 9 and 20 EMA and volume.
The condition is strict. The index must break and hold above its level, and the stock must break its own micro base in the same direction, with clean structure, within the next few candles. Alignment is everything.
Entry: when the stock breaks its micro base with volume, after the index has broken and held.
Stop: at the stock's base low.
Exit: a fixed scalp target, or the correlation breaking. If the index loses its breakout level, or the index holds but your stock stalls and fails to follow, the reason for the trade is gone and you exit even before the target.
The Analogy
Think of a flock of cranes crossing the sky in formation. When the lead bird banks into a turn, the rest of the flock follows a moment later. If you want to know where any single bird is headed, watch the leader. The index is the lead bird, the stock is one of the flock. A stock breaking while the index breaks with it is a bird turning in step with the formation. But if the leader holds its line and one bird peels away alone, something is wrong, and that is your signal to stand aside.

A Worked Example
This example uses: entry ₹500, account capital ₹5,00,000, 1% risk per trade (₹5,000). The stop distance varies by setup.
Nifty breaks and holds above an intraday level. Within a few candles, the chosen stock breaks its own micro base near ₹500 with volume, in the same direction.
Step | Level (₹) | Detail |
|---|---|---|
Index condition | - | Nifty breaks and holds above its intraday level |
Stock micro base | 496 to 500 | Stock coiling in a tight base below ₹500 |
Stock breakout (with volume) | 500 | Stock breaks its base in the index's direction |
Entry (aligned break) | 500 | Enter as stock breaks with index confirmation |
Stop (stock base low) | 496 | Risk = ₹4 per share |
Position size | 1,250 shares | ₹5,000 / ₹4 |
Target (2R fixed scalp) | 508 | Reward = ₹8 per share, R-multiple = 2.0R |
Correlation exit | - | Index loses its level, or stock stalls while index holds |
Common Mistakes
Mistake 1: Trading the stock breakout without index confirmation
The entire edge comes from alignment. A stock breaking while the index is flat or moving the other way is exactly the weak, isolated breakout this setup is designed to filter out. No index confirmation, no trade.
Mistake 2: Ignoring the correlation exit
This setup has a second exit beyond the target. If the index loses its breakout level, or holds while your stock stalls, the reason for the trade has broken. Waiting for your stop when the correlation has already failed gives back more than necessary. Exit when the alignment breaks.
Key Takeaways
- The Index vs Stock Breakout Scalp trades a stock breakout only when the index (Nifty or Bank Nifty) breaks and holds in the same direction, using correlation as a filter.
- Enter when the stock breaks its micro base with volume after the index has broken and held. Stop goes at the stock base low.
- Exit at a fixed scalp target, or earlier if the correlation breaks: the index losing its level, or the stock stalling while the index holds.
Assignment
- Open the Nifty spot chart and a liquid Nifty constituent side by side, both on the 3-minute timeframe.
- Watch for a moment when the index breaks an intraday level. Did your stock break in the same direction within a few candles?
- If so, measure how far it travelled.
Note one case where the stock broke without the index, and observe how much less reliable that isolated break was. Record your findings.
Course Conclusion
You have now completed all ten chapters of the Scalping Trading Strategies course. You have a foundation in what scalping demands, and nine specific setups across three styles: trend-based scalps that follow momentum, mean reversion scalps that fade exhaustion, and breakout scalps that trade expansion. Each has clear entry, stop, and exit rules, all built on the same disciplined risk base of 1% per trade.
The next step is screen time. Scalping is a skill of execution, and execution is learned by repetition. Practise each setup on a simulator or with the smallest possible size before scaling up, and keep a journal of every trade.
The edge in scalping is not any single setup. It is the discipline to take only the clean ones, again and again.
For the multi-day versions of these tools, the Kotak Stockshaala Swing Trading course covers the same indicators on higher timeframes, in text and video. Check out here →
Disclaimer: This article is for informational purposes only and does not constitute financial advice. It is not produced by the desk of the Kotak Neo Research Team, nor is it a report published by the Kotak Neo Research Team. The information presented is compiled from several secondary sources available on the internet and may change over time. Investors should conduct their own research and consult with financial professionals before making any investment decisions. Read the full disclaimer here.
Investments in securities market are subject to market risks, read all the related documents carefully before investing. Brokerage will not exceed SEBI prescribed limit. The securities are quoted as an example and not as a recommendation. SEBI Registration No-INZ000200137 Member Id NSE-08081; BSE-673; MSE-1024, MCX-56285, NCDEX-1262.
Recommended Courses for you



















Learn, Invest, and Grow with Kotak Videos
Explore our comprehensive video library that blends expert market insights with Kotak's innovative financial solutions to support your goals.

Trading with collateral as margin with Kotak Neo

How India is Redefining Space Exploration

