

Kotak
Stockshaala
Chapter 2 | 3 min read
Key Level Rejection Scalping
Price surged up to the previous day's high, poked just above it, and for a second the breakout looked real. Then it snapped back below the level on the very next candle, trapping every trader who bought the break. That failure, that instant where an obvious level holds and rejects price, was itself the trade. The scalper who faded it caught the quick move back toward the middle.
This is the Key Level Rejection Scalp. It fades failed breakouts at obvious levels, taking a quick target back toward the mean.
The Setup
This setup fades failed breaks at obvious levels: the previous day's high and low, or clear intraday swing highs and lows.
These levels are obvious to everyone, which is exactly why they work. Breakout traders pile in as price tags the level, and when the break fails, their forced exits fuel the snap back the other way.
The signal: a rejection candle at the level followed by follow-through. Price reaches the level, prints a candle that closes back away from it, and then the next candle confirms by continuing in the rejection's direction.
That follow-through is what separates a genuine failed break from a brief pause.
Entry: on the rejection with follow-through, fading the failed breakout.
Stop: just beyond the level, because a clean break and hold beyond it means the level did not hold and your fade is wrong.
Target: a quick move back to the EMA mean.
This is a fast fade, not a trend trade.
The Analogy
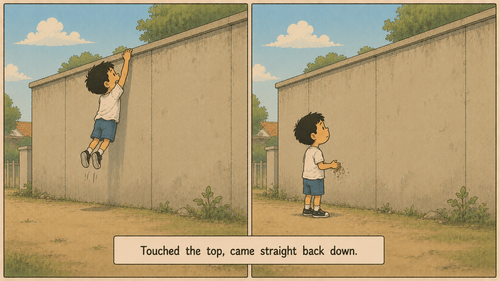
Picture a boy trying to get over a high compound wall. He runs, jumps, and his fingertips just brush the top edge before he drops back down and dusts off his hands. The wall has not moved. Each failed attempt confirms it is solid. A key level is that wall. When price reaches up, fails to get a grip, and falls straight back, the rejection confirms the level is holding, and the fade is a bet on gravity, not on getting over.
A Worked Example
This example uses: entry ₹500, account capital ₹5,00,000, 1% risk per trade (₹5,000). The stop distance varies by setup.
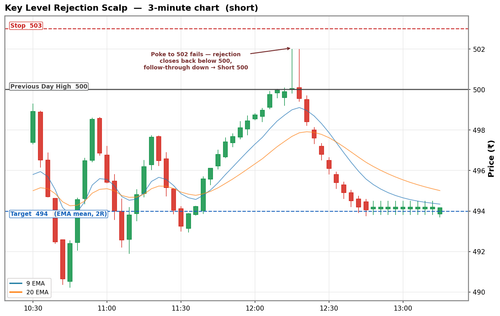
Note that this is a short trade. Price pushes up to the previous day's high near ₹500, fails to hold above it, and prints a rejection candle with follow-through.
Step | Level (₹) | Detail |
|---|---|---|
Level in focus | 500 | Previous day's high, an obvious level |
Failed break | up to 502 | Price pokes to ₹502, cannot hold above ₹500 |
Rejection candle | closes at 500 | Closes back below the level |
Follow-through | - | Next candle continues down, confirming the fade |
Entry (short, on follow-through) | 500 | Enter short as the rejection confirms |
Stop (beyond the level) | 503 | Risk = ₹3 per share |
Position size | 1,666 shares | ₹5,000 / ₹3 |
Target (EMA mean) | 494 | Reward = ₹6 per share, R-multiple = 2.0R |
Common Mistakes
Mistake 1: Fading without follow-through
A single rejection candle can be a pause before the breakout continues. The follow-through candle is your confirmation that the break has genuinely failed. Entering on the rejection alone, before follow-through, is jumping the gun.
Mistake 2: Fading a level that is breaking on strong volume
Not every level holds. A break on strong, expanding volume is often the real thing. If price closes and holds beyond the level with force, the fade is wrong. That is exactly why the stop sits just beyond the level, to get you out quickly when the break is genuine.
Key Takeaways
- The Key Level Rejection Scalp fades failed breakouts at obvious levels: the previous day's high and low, or clear intraday swing points.
- The trigger is a rejection candle at the level with follow-through. Enter on the follow-through; stop goes just beyond the level.
- Target a quick move back to the EMA mean. A clean break and hold beyond the level invalidates the fade.
Assignment
- Mark the previous day's high and low and one clear intraday swing level on a 3-minute chart. Watch for price reaching one of them. Did it break and hold, or reject and fail?
- On the failures, was there a follow-through candle, and how far did price travel back toward the mean?
- Note one case where the level genuinely broke, and what distinguished it from the fades.
In the final chapter, we combine the index and the individual stock into one setup. The Index vs Stock Breakout Scalp trades a stock breakout only when the index confirms the move, filtering out the weakest breaks.
Disclaimer: This article is for informational purposes only and does not constitute financial advice. It is not produced by the desk of the Kotak Neo Research Team, nor is it a report published by the Kotak Neo Research Team. The information presented is compiled from several secondary sources available on the internet and may change over time. Investors should conduct their own research and consult with financial professionals before making any investment decisions. Read the full disclaimer here.
Investments in securities market are subject to market risks, read all the related documents carefully before investing. Brokerage will not exceed SEBI prescribed limit. The securities are quoted as an example and not as a recommendation. SEBI Registration No-INZ000200137 Member Id NSE-08081; BSE-673; MSE-1024, MCX-56285, NCDEX-1262.
Recommended Courses for you



















Learn, Invest, and Grow with Kotak Videos
Explore our comprehensive video library that blends expert market insights with Kotak's innovative financial solutions to support your goals.

Trading with collateral as margin with Kotak Neo

How India is Redefining Space Exploration

