


Kotak
Stockshaala
Chapter 6 | 2 min read
Return on Equity (ROE) and Return on Assets (ROA): Calculation in Excel
Return on Equity (ROE) and Return on Assets (ROA) are fundamental profitability ratios that provide insights into a company’s efficiency in generating returns from its equity and assets. These ratios are key indicators for investors and analysts to assess financial performance. In this chapter, we’ll explore how to calculate ROE and ROA using Excel for quick and accurate analysis.
What Are ROE and ROA?
- Return on Equity (ROE) measures the profitability generated from shareholders' equity.
- Return on Assets (ROA) measures how efficiently a company uses its assets to generate profit.
Return on Equity (ROE):
The Return on Equity indicates the profitability generated from each unit of shareholder investment. A higher ROE suggests better management and efficient use of equity capital.
Formula for ROE:
ROE = (Net Income / Shareholders’ Equity) × 100
Step-by-Step Guide: Calculating ROE in Excel
Step 1: Input Data
Suppose a company reports:
- Net Income = ₹12,00,000
- Shareholders’ Equity = ₹40,00,000
₹12,00,000 | ₹40,00,000 |
Step 2: Apply the ROE Formula
In Excel, use the formula to calculate ROE:
=(Net Income / Shareholders' Equity) * 100
For this example:
=(1200000 / 4000000) * 100
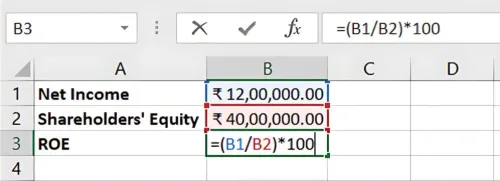
Result: The ROE is 30%, indicating that the company generates 30% return on every ₹1 of equity invested by shareholders.
Return on Assets (ROA)
The Return on Assets ratio evaluates how efficiently a company uses its assets to generate profit. A higher ROA indicates more efficient asset use.
Formula for ROA: ROA = (Net Income / Total Assets) × 100
Step-by-Step Guide: Calculating ROA in Excel
Step 1: Input Data
Assume the company has:
- Net Income = ₹12,00,000 (from above)
- Total Assets = ₹60,00,000
₹12,00,000 | ₹60,00,000 |
Step 2: Apply the ROA Formula
In Excel, the ROA formula is:
=(Net Income / Total Assets) * 100
For this example:
=(1200000 / 6000000) * 100
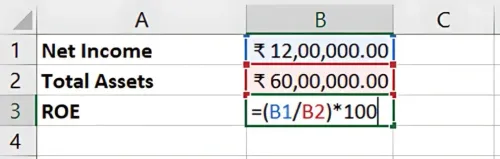
Result: The ROA is 20%, meaning the company generates a 20% return on its assets, reflecting effective asset utilisation.
Why Are ROE and ROA Important?
- ROE focuses on how well a company generates profits from shareholder equity, important for investors evaluating stock performance.
- ROA assesses asset efficiency, valuable for understanding management’s use of resources.
- Comparison: ROE and ROA help in comparing performance across companies, sectors, or time periods.
Benefits of Using Excel for ROE and ROA Calculations
- Accuracy: Excel automates the calculations, ensuring precision.
- Scenario Testing: You can adjust Net Income, Equity, or Assets to see the impact on ROE and ROA.
- Time-Efficiency: Excel’s functions allow quick calculations, ideal for fast-paced financial analysis.
Key Takeaways:
- ROE measures profitability from shareholder equity, while ROA evaluates asset efficiency.
- Excel simplifies ROE and ROA calculations, making it easy to analyse and compare performance.
- Use these metrics for assessing company health, operational efficiency, and shareholder returns.
Conclusion
Calculating ROE and ROA provides valuable insights into how well a company utilises its equity and assets to generate profits. Excel enables quick and accurate analysis, essential for making informed financial and investment decisions.
Next Chapter Preview: In the next chapter, we will explore Dividend Yield and Dividend Payout Ratio Calculations, two key ratios for investors to evaluate a company’s dividend policies and cash returns. Stay tuned!
Recommended Courses for you


Learn, Invest, and Grow with Kotak Videos
Explore our comprehensive video library that blends expert market insights with Kotak's innovative financial solutions to support your goals.

Trading with collateral as margin with Kotak Neo

How India is Redefining Space Exploration

