


Kotak
Stockshaala
Chapter 3 | 3 min read
Building a Sensitivity Analysis Model in Excel
Sensitivity analysis is a powerful tool used in financial modelling to assess how changes in key assumptions impact the results of a model. By testing various input assumptions, such as revenue growth rates, cost structures, or discount rates, you can evaluate the model’s robustness and determine which factors have the greatest influence on the outcome. In this chapter, we will explore how to build a sensitivity analysis model in Excel, helping you understand the risks and uncertainties associated with financial projections.
What is Sensitivity Analysis?
Sensitivity analysis measures how the output of a model changes in response to variations in input variables. It is commonly used to identify key drivers in a model, providing insight into which assumptions are most critical to the overall outcome.
Why is Sensitivity Analysis Important?
-
Risk Identification: Sensitivity analysis helps identify which variables have the highest impact on outcomes, allowing you to focus on critical assumptions.
-
Decision Making: By understanding how sensitive a model is to changes in inputs, you can make more informed business and investment decisions.
-
Scenario Planning: Sensitivity analysis allows you to simulate different business scenarios, giving you insights into the potential range of outcomes.
Step-by-Step Guide: Building a Sensitivity Analysis Model
Step 1: Create a Base Case Financial Model
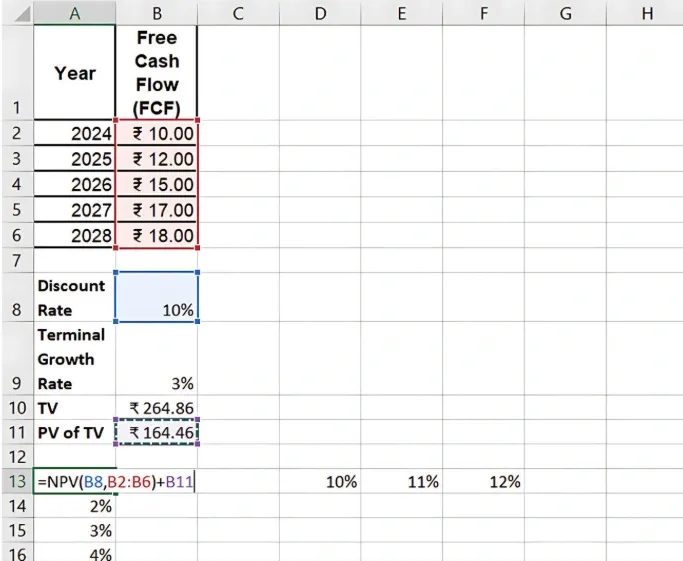
Before conducting sensitivity analysis, you need to have a base case model. Let’s assume we are working with a Discounted Cash Flow (DCF) model where the Net Present Value (NPV) of a project is calculated based on projected cash flows, a discount rate (WACC), and growth rates.
2024 | ₹10M |
2025 | ₹12M |
2026 | ₹15M |
2027 | ₹17M |
2028 | ₹18M |
Assume the base discount rate is 10% and the terminal growth rate is 3%. You calculate the NPV using these assumptions as the base case.
Step 2: Identify Key Variables for Sensitivity Analysis
Choose the variables that you want to test in the model. For our example, key inputs for sensitivity analysis might include:
-
Discount Rate (WACC): Test the impact of different discount rates (e.g., 8%, 9%, 10%, 11%, 12%).
-
Terminal Growth Rate (g): Test different growth rates (e.g., 2%, 3%, 4%).
Step 3: Set Up the Sensitivity Table in Excel
-
Create Input Variables: In a separate section of the worksheet, list the range of values for the discount rate and terminal growth rate.
-
Set Up Data Table:
- Place the different discount rates in a row (horizontally).
- Place the different terminal growth rates in a column (vertically).
- In the intersection cell, enter the formula for NPV, referencing the base case values.
Step 4: Use Excel’s Data Table Function
-
Select the Sensitivity Table Range: Highlight the entire table, including the row and column of variable values.
-
Use the Data Table Function: Go to Data > What-If Analysis > Data Table.
- For the Row Input Cell, select the cell where the discount rate is entered in the model.
- For the Column Input Cell, select the cell where the terminal growth rate is entered.
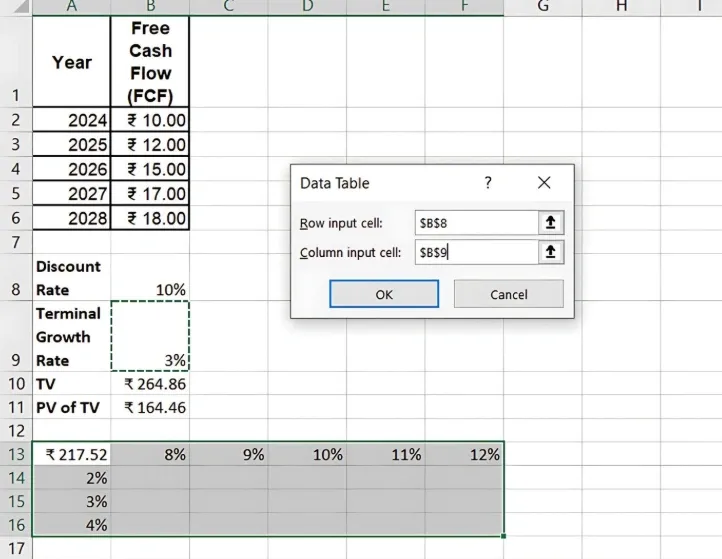
Excel will automatically calculate the NPV for each combination of discount rates and growth rates, filling out the sensitivity table.
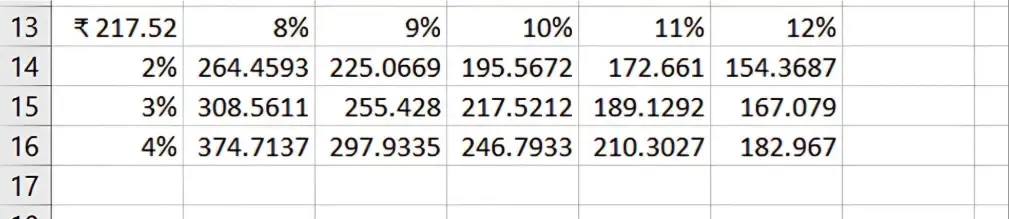
Step 5: Interpret the Results
The sensitivity table shows how changes in the discount rate and growth rate affect the NPV. This allows you to see which variables have the most significant impact on the project’s valuation.
For example:
Benefits of Sensitivity Analysis
-
Risk Assessment: Sensitivity analysis helps identify the most volatile assumptions, allowing you to focus on mitigating risks.
-
Range of Outcomes: Provides a clear picture of the range of possible outcomes, helping in scenario planning.
-
Informed Decision Making: Allows businesses to make better decisions by understanding the effect of key drivers on financial metrics.
Key Takeaways:
-
Sensitivity Analysis allows you to test how changes in key inputs affect the outcome of a financial model.
-
Use Excel’s Data Table feature to automate sensitivity calculations and create dynamic tables for easy interpretation.
-
This tool is crucial for understanding the risks and potential variability in financial models.
Conclusion:
Building a sensitivity analysis model in Excel helps evaluate the impact of changing key assumptions on financial outcomes. It is a crucial tool for risk assessment and informed decision-making in financial modelling.
Next Chapter Preview: In the next chapter, we will dive into Scenario Analysis and Monte Carlo Simulation for Risk Assessment, where we’ll explore how to create scenarios with multiple variables and perform Monte Carlo simulations to assess risk. Stay tuned for advanced techniques in financial modelling!
Recommended Courses for you


Learn, Invest, and Grow with Kotak Videos
Explore our comprehensive video library that blends expert market insights with Kotak's innovative financial solutions to support your goals.

Trading with collateral as margin with Kotak Neo

How India is Redefining Space Exploration

