


Kotak
Stockshaala
Chapter 2 | 5 min read
Volume-Based Indicators: OBV (On-Balance Volume)
The on-balance volume (OBV) is one of the most popular volume-based technical indicators that traders use to measure the flow of volume into and out of a security. Developed by Joe Granville in the 1960s, OBV aims to identify the strength of a trend by looking at how much volume accompanies the price movements. The basic premise is that volume precedes price; therefore, when there is a significant change in volume without a corresponding price change, a price movement may soon follow.
In this article, we will explain how OBV works, how traders interpret it, and how it can be used to confirm price trends or predict reversals.
What Is On-Balance-Volume (OBV)?
The on-balance volume (OBV) is a volume-based indicator that measures cumulative buying and selling pressure. The idea behind OBV is that volume precedes price, meaning that large volume movements without significant price changes could signal an upcoming change in price direction. The OBV line moves up or down based on wheter the market closes higher or lower on a given day.
Here’s how OBV is calculated:
- If the price closes higher than the previous close, the day’s volume is added to the OBV.
- If the price closes lower than the previous close, the day’s volume is subtracted from the OBV.
- If the price remains unchanged, the OBV remains the same.
Over time, the OBV line forms a pattern that traders can use to identify whether volume is flowing into or out of the asset, which could signal bullish or bearish sentiment.
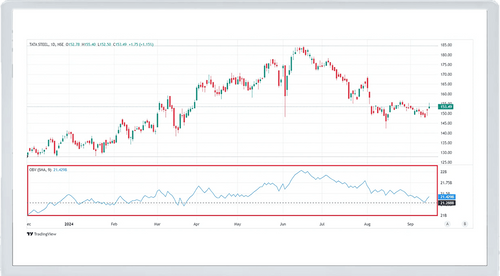
Image Courtesy: Tradingview
How to Interpret OBV
The OBV indicator is relatively simple to interpret, but its usefulness lies in its ability to confirm trends and detect potential reversals. Here’s how traders interpret OBV:
1. Trend Confirmation
OBV is often used to confirm price trends. If OBV is moving in the same direction as the price trend, it suggests that the trend is supported by volume, which means the trend is likely to continue.
- If both OBV and price are making higher highs, we can confirm the uptrend, and the market may continue to rise.
- If both OBV and price are making lower lows, we can confirm the downtrend, and the market may continue to fall.
2. Divergence
One of the most powerful signals OBV provides is divergence, which occurs when OBV moves in the opposite direction of the price. The divergence between OBV and price can signal a potential reversal.
-
Bullish Divergence: If the price is making lower lows while OBV is making higher lows, it suggests that selling pressure is weakening, and a bullish reversal may occur.
-
Bearish Divergence: If the price is making higher highs while OBV is making lower highs, it signals that buying pressure is weakening, and a bearish reversal could follow.
3. Breakouts
Traders also use OBV to detect breakouts. When OBV breaks above or below a key trendline before the price does, it can signal an impending breakout in price. For example, if OBV breaks above a resistance level, it may signal a bullish breakout, even if the price hasn’t moved significantly yet.
How Traders Use OBV
OBV is a versatile tool that can be used in a variety of ways, from confirming trends to predicting reversals. Below are some common strategies traders use with OBV:
1. OBV and Trendlines
Just like price charts, OBV lines can form trendlines. Traders can draw support and resistance levels on the OBV line and look for breakouts that may signal a change in the price trend. For example, if the OBV breaks above a descending resistance trendline, it may signal that buying pressure is increasing, and the price could break out upward.
2. Using OBV with Moving Averages
Some traders combine OBV with moving averages to enhance their trading strategy. A common approach is to apply a moving average to the OBV line itself and look for crossovers:
-
When OBV crosses above the moving average, it suggests that volume is increasing, which may signal a buying opportunity.
-
When OBV crosses below the moving average, it suggests that volume is decreasing, which may signal a selling opportunity.
3. OBV and Divergence
The divergence between OBV and price is a powerful signal that traders use to spot potential trend reversals. For example:
-
In an uptrend, if the price continues to make higher highs while OBV begins to make lower highs, it suggests that the upward momentum is weakening, and a reversal may be near.
-
In a downtrend, if OBV starts to rise while the price continues to make lower lows, it suggests that the selling pressure is decreasing, and the market may be due for a bounce.
Example: Using OBV in Tata Steel
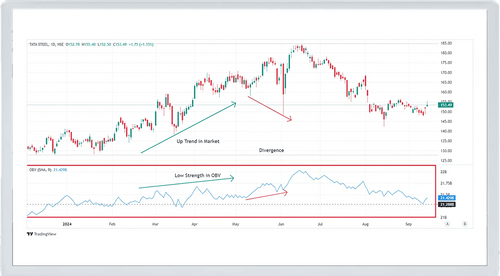
Image Courtesy: Tradingview
Let’s consider Tata Steel as an example. Suppose the price of Tata Steel has been rising steadily, but you notice that the OBV is not keeping pace and has started to flatten or even decline. This bearish divergence between price and OBV suggests that the upward momentum may be weakening and that the stock could be due for a pullback. Traders might take this signal as a warning to tighten stop-loss orders or even take profits before the price reverses.
On the flip side, if Tata Steel’s price has been trending downward but OBV is rising, it suggests that buying pressure is increasing. This bullish divergence may signal that a reversal is near, prompting traders to look for buying opportunities.
Adjusting OBV Settings for Different Strategies
While OBV is straightforward, traders can adjust the timeframe over which they track OBV depending on their strategy:
- Short-term traders may use OBV in shorter timeframes (such as hourly or 4-hour charts) to detect quick volume-based signals.
- Long-term traders typically use OBV on daily, weekly, or even monthly charts to confirm long-term trends and spot major reversals.
OBV works best when used in combination with other indicators, such as moving averages, RSI, or MACD, to confirm signals and filter out noise from the market.
Common Mistakes to Avoid
While OBV is a useful tool, it’s important to be cautious of some common mistakes:
-
Overreliance on OBV Alone: OBV should be used in conjunction with other technical indicators. On its own, OBV may not provide enough confirmation to make trading decisions.
-
Ignoring Market Context: Volume-based indicators like OBV work best when interpreted within the broader context of market conditions. For example, a divergence in a strong uptrend may not immediately result in a reversal, as strong trends often persist longer than expected.
-
Not Adjusting for Long-Term Trends: OBV is cumulative, meaning it adds up volume data over time. Traders should be mindful of the timeframe they are analysing, as OBV can sometimes give conflicting signals on different timeframes.
Conclusion
The On-Balance Volume (OBV) indicator is a valuable tool for traders looking to understand volume trends and how they impact price movements. By combining OBV with other technical indicators, traders can confirm trends, spot divergences, and predict potential breakouts or reversals.
In the next chapter, we’ll explore another volume-based indicator: The Ichimoku Cloud, which provides additional insights into price action and trend direction rather than the relationship between price and volume.
Recommended Courses for you


Learn, Invest, and Grow with Kotak Videos
Explore our comprehensive video library that blends expert market insights with Kotak's innovative financial solutions to support your goals.

Trading with collateral as margin with Kotak Neo

How India is Redefining Space Exploration

