


Kotak
Stockshaala
Chapter 4 | 5 min read
Triangles: Symmetrical, Ascending, and Descending
In technical analysis, triangle patterns are widely used by traders to identify potential continuation or reversal signals in the market. These patterns provide insight into periods of market consolidation, where the price moves within a narrowing range before breaking out. Triangle patterns come in three main forms: Symmetrical, Ascending, and Descending. Each type offers valuable clues about future price movements and helps traders anticipate breakouts or breakdowns.
In this chapter, we’ll explore the structure and significance of each triangle pattern, as well as how traders can use them effectively to improve their trading strategies. Let’s begin with the Symmetrical Triangle, the most neutral of the three.
1. Symmetrical Triangle: Neutral Consolidation Pattern
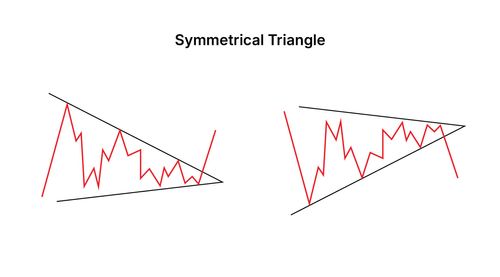
The Symmetrical Triangle pattern is a continuation pattern that forms when the price moves in a narrowing range, creating a symmetrical shape. This pattern occurs when neither buyers nor sellers have control, and the market consolidates before breaking out in either direction. The key characteristic of a symmetrical triangle is that the highs and lows converge toward a single point, creating two trendlines that meet.
How to Spot a Symmetrical Triangle?
- The pattern forms when the price creates a series of lower highs and higher lows, narrowing the range.
- Two trend lines are drawn: one connecting the lower highs and the other connecting the higher lows.
- The price consolidates within this range, and the breakout direction is uncertain until it occurs.
Reference of Symmetrical Triangle
A Symmetrical Triangle can break out in either direction, depending on market sentiment. Traders typically wait for the breakout to occur before entering a trade. Let’s look at an example to understand how traders use the Symmetrical Triangle.
Example: Symmetrical Triangle in Tata Motors
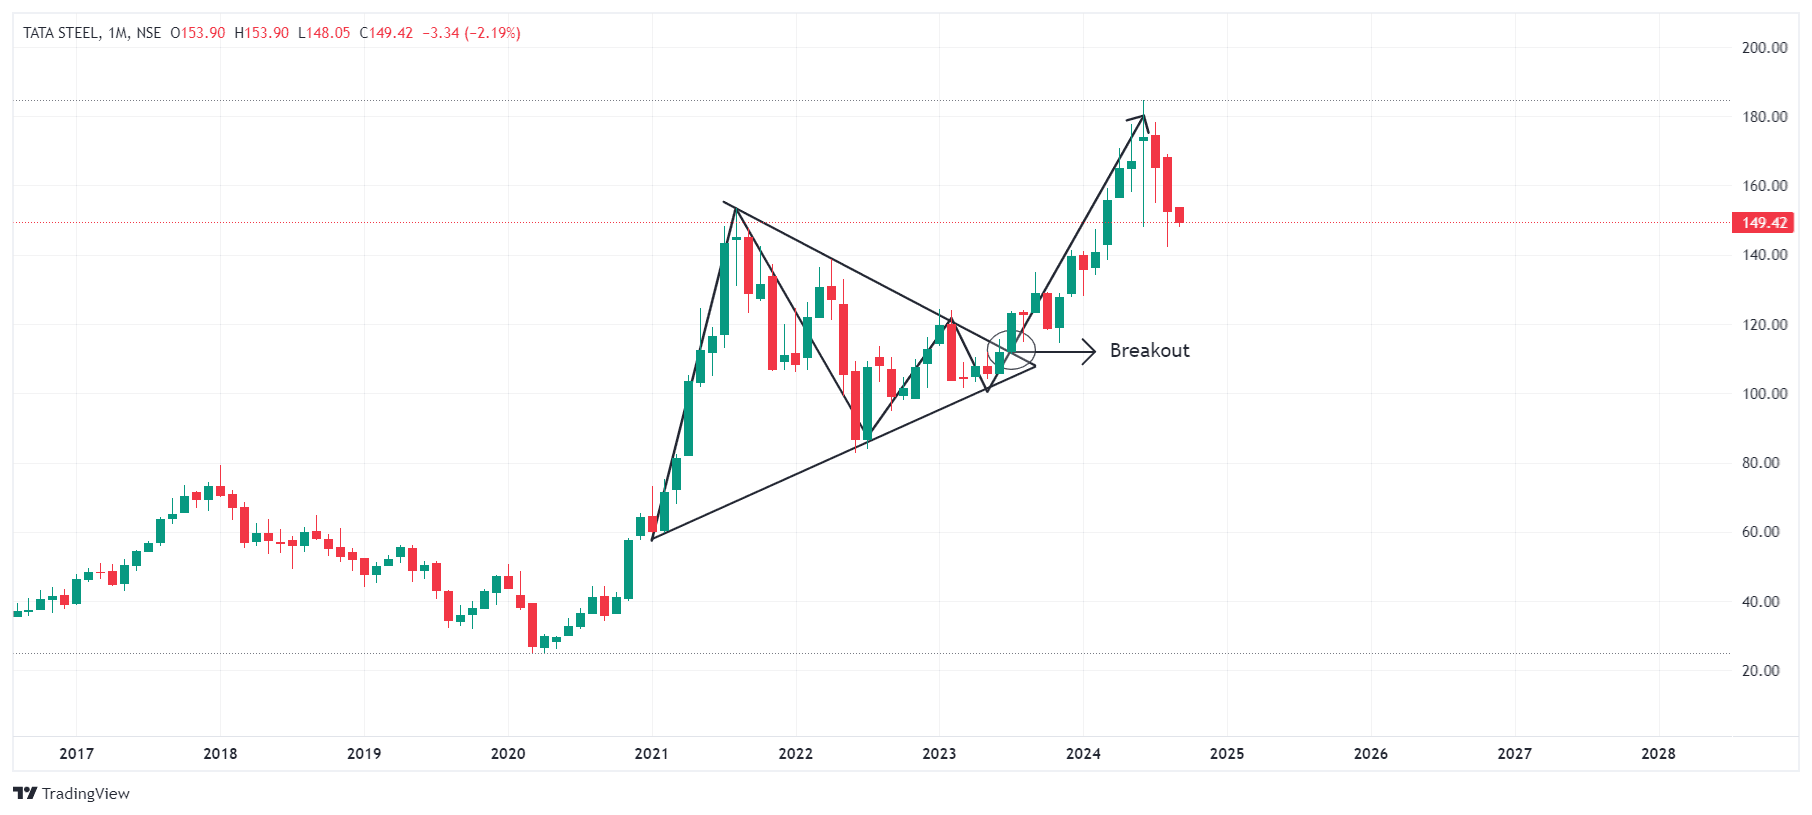
Image Courtesy: Tradingview
Imagine Tata Steel has been in an uptrend, but the price starts consolidating and forming lower highs and higher lows. This creates a Symmetrical Triangle pattern as the price moves within a tightening range. Eventually, the price breaks out above the upper trendline, signalling a continuation of the uptrend. Traders may enter a long position at the breakout point, expecting further gains.
While the Symmetrical Triangle is neutral, the Ascending Triangle has a bullish bias, which we’ll explore next.
2. Ascending Triangle: A Bullish Continuation Pattern
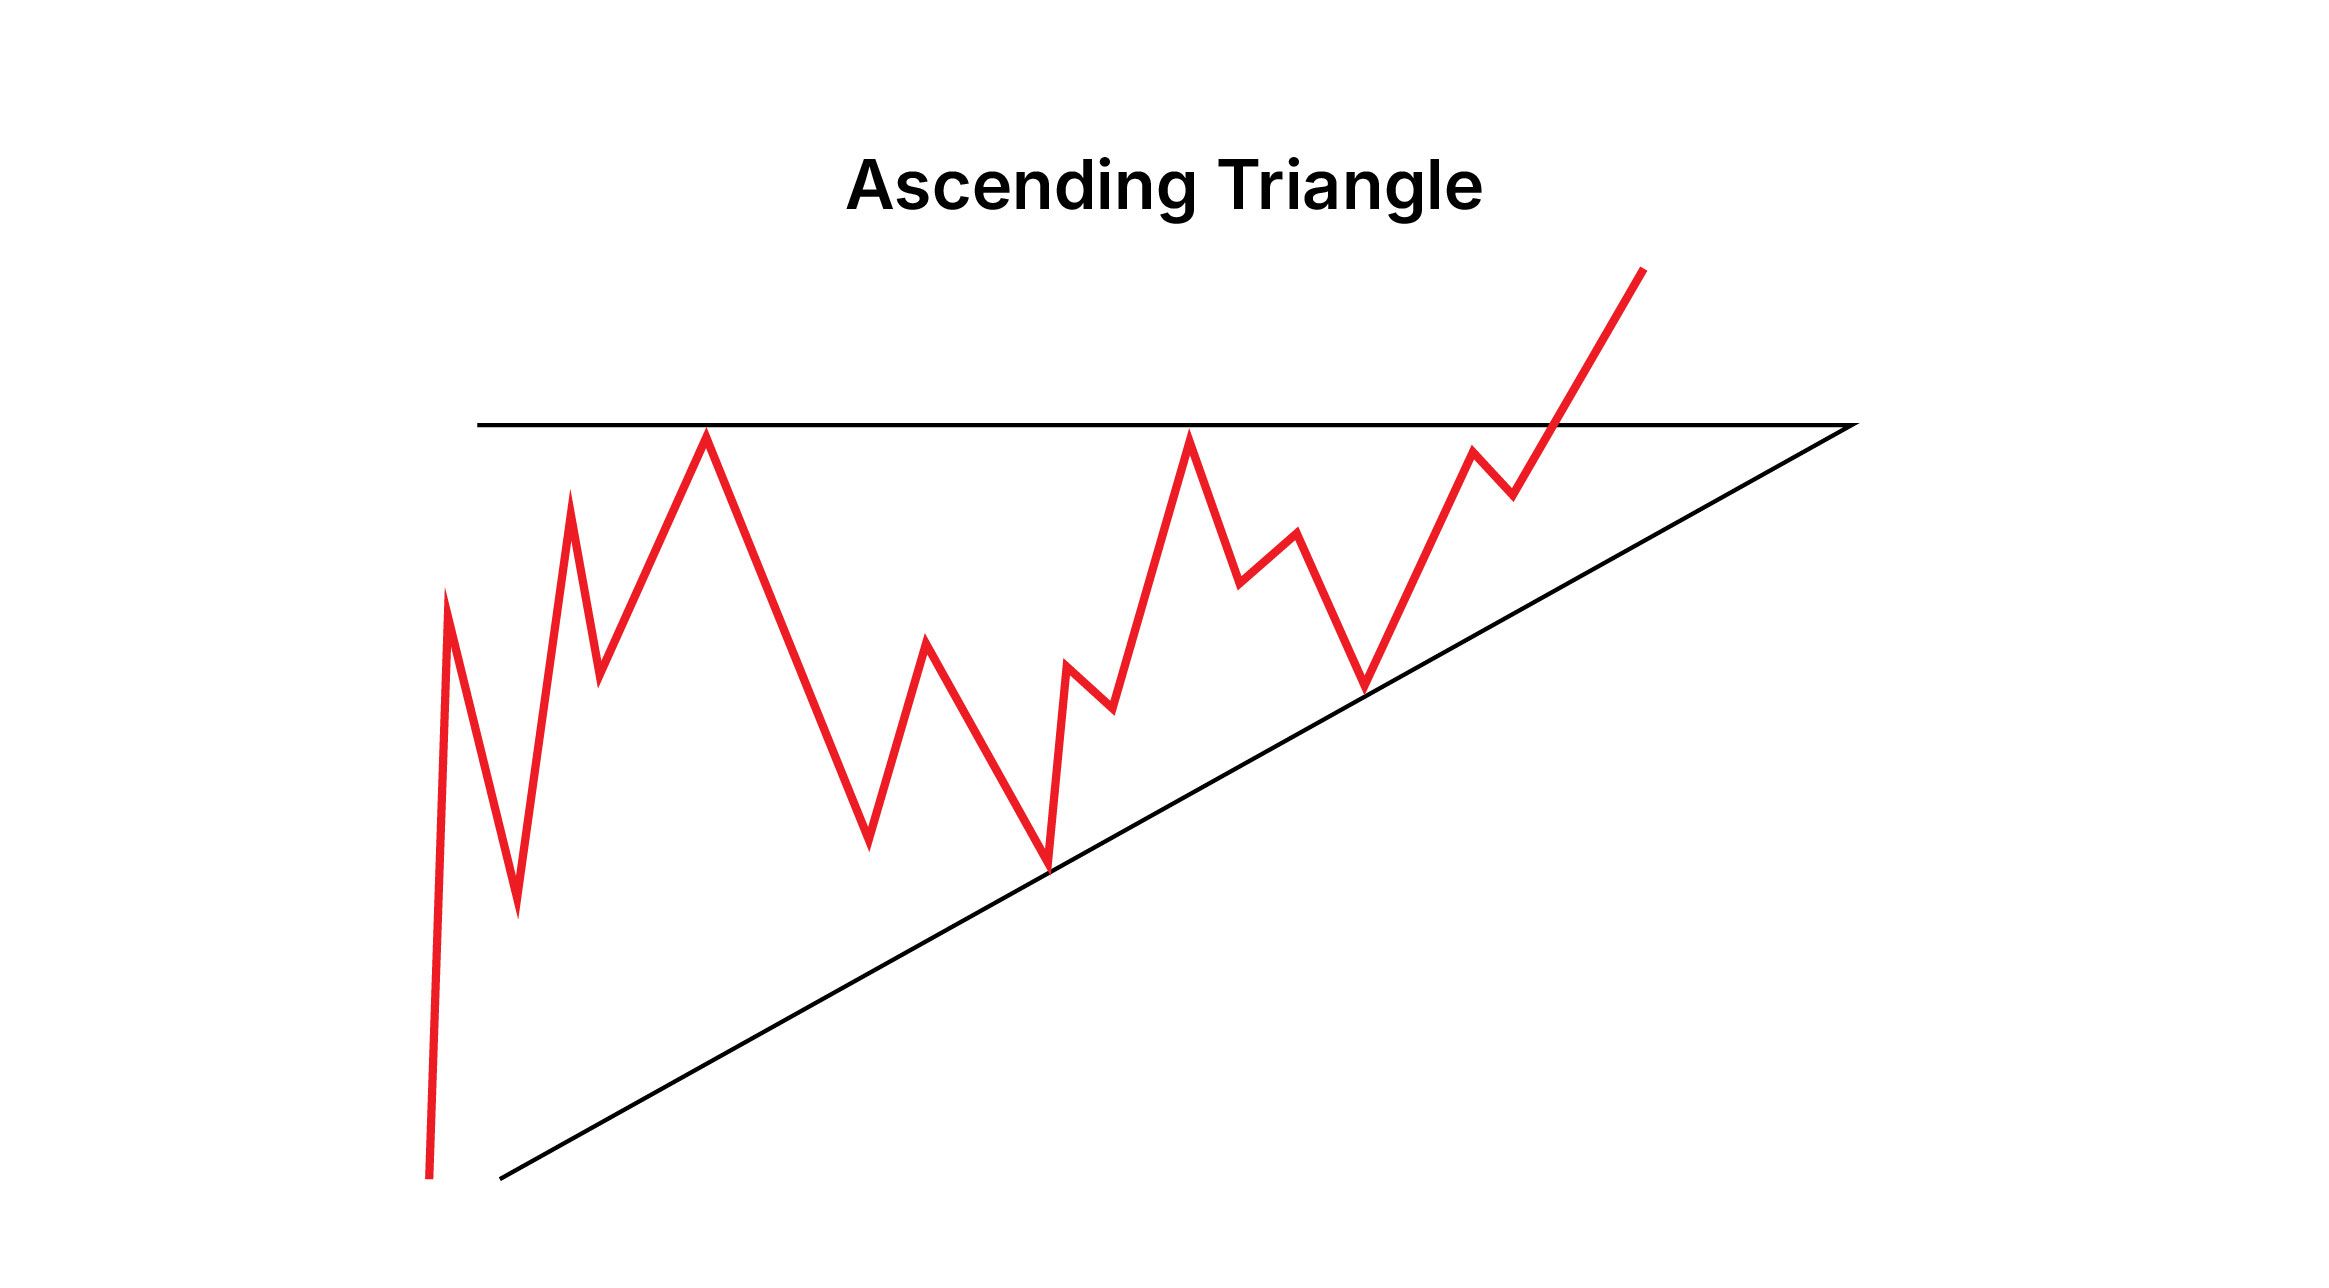
The Ascending Triangle is a bullish continuation pattern that forms when the price creates a series of higher lows while facing resistance at a horizontal level. This pattern indicates that buyers are gaining strength, and the market is likely to break out upward. The horizontal resistance level shows that sellers are trying to cap the price, but the rising lows suggest that buyers are consistently pushing the price higher.
How to Spot an Ascending Triangle?
- The pattern forms when the price makes higher lows, creating an upward-sloping trendline.
- A horizontal resistance level forms as the price hits the same high multiple times but fails to break through.
- The breakout typically occurs above the resistance level, confirming the bullish continuation.
Reference of Ascending Triangle
The Ascending Triangle signals that buyers are gaining control and that the price is likely to break out upward. Let’s explore an example of how traders use this pattern.
Example: Ascending Triangle in Reliance Industries
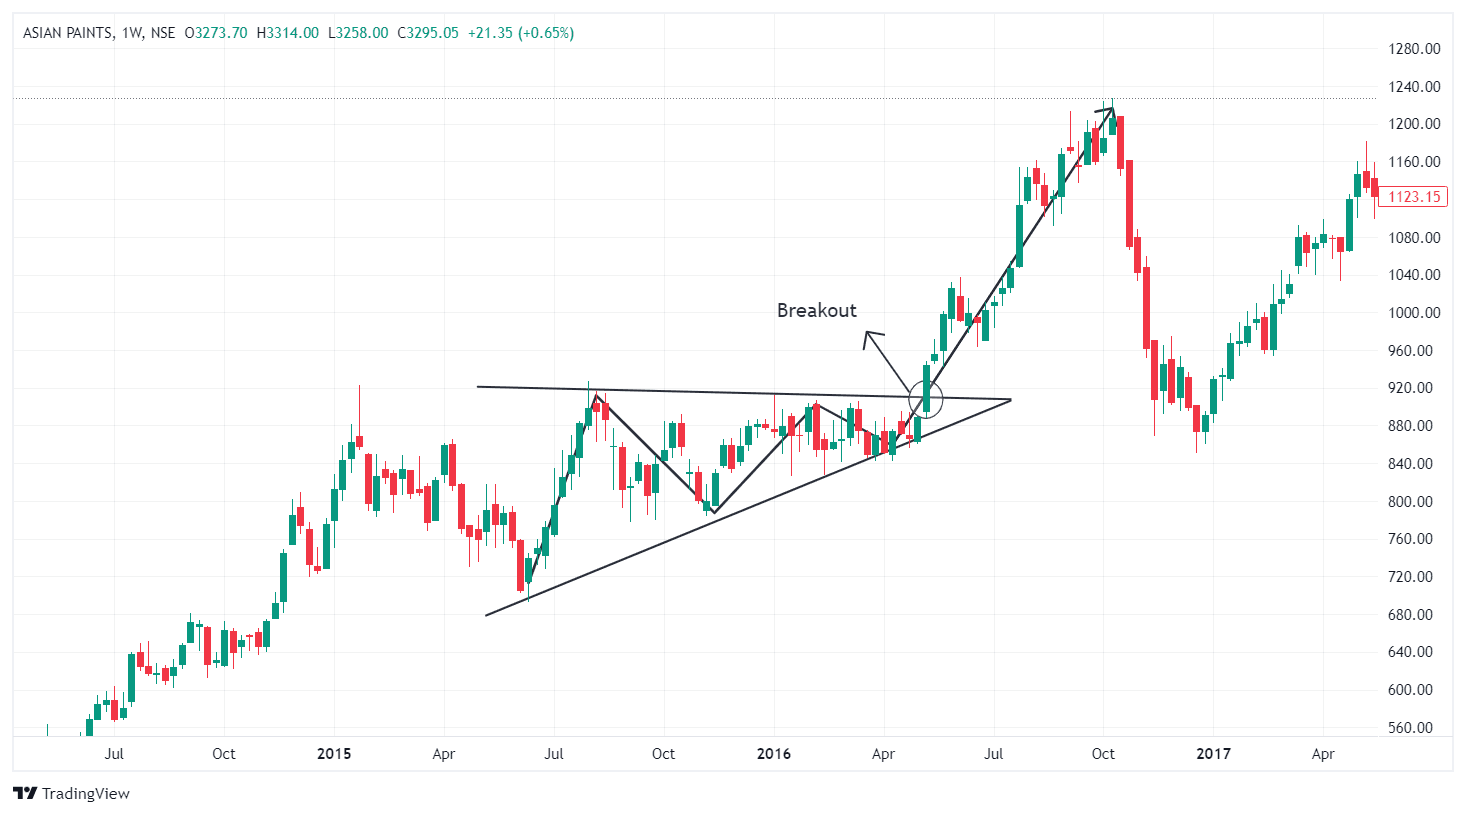
Image Courtesy: Tradingview
Let’s say Asian Paints is in an uptrend and forms an Ascending Triangle as the price repeatedly hits resistance at ₹2500 but makes higher lows. Eventually, the price breaks above ₹2500, confirming the bullish breakout. Traders may enter a long position at the breakout, anticipating further upward movement.
While the Ascending Triangle is bullish, the Descending Triangle is its bearish counterpart, which we’ll examine next.
3. Descending Triangle: A Bearish Continuation Pattern
The Descending Triangle is a bearish continuation pattern that forms when the price creates a series of lower highs while finding support at a horizontal level. This pattern suggests that sellers are gaining strength, and the market is likely to break down. The horizontal support level shows that buyers are trying to hold the price, but the declining highs indicate that sellers are consistently pushing the price lower.
How to Spot a Descending Triangle?
- The pattern forms when the price makes lower highs, creating a downward-sloping trendline.
- A horizontal support level forms as the price hits the same low multiple times but fails to break below.
- The breakout typically occurs below the support level, confirming the bearish continuation.

Reference of Descending Triangle
The Descending Triangle signals that sellers are in control and that the price is likely to break down. Let’s look at an example of how traders use the Descending Triangle.
Example: Descending Triangle in Infosys
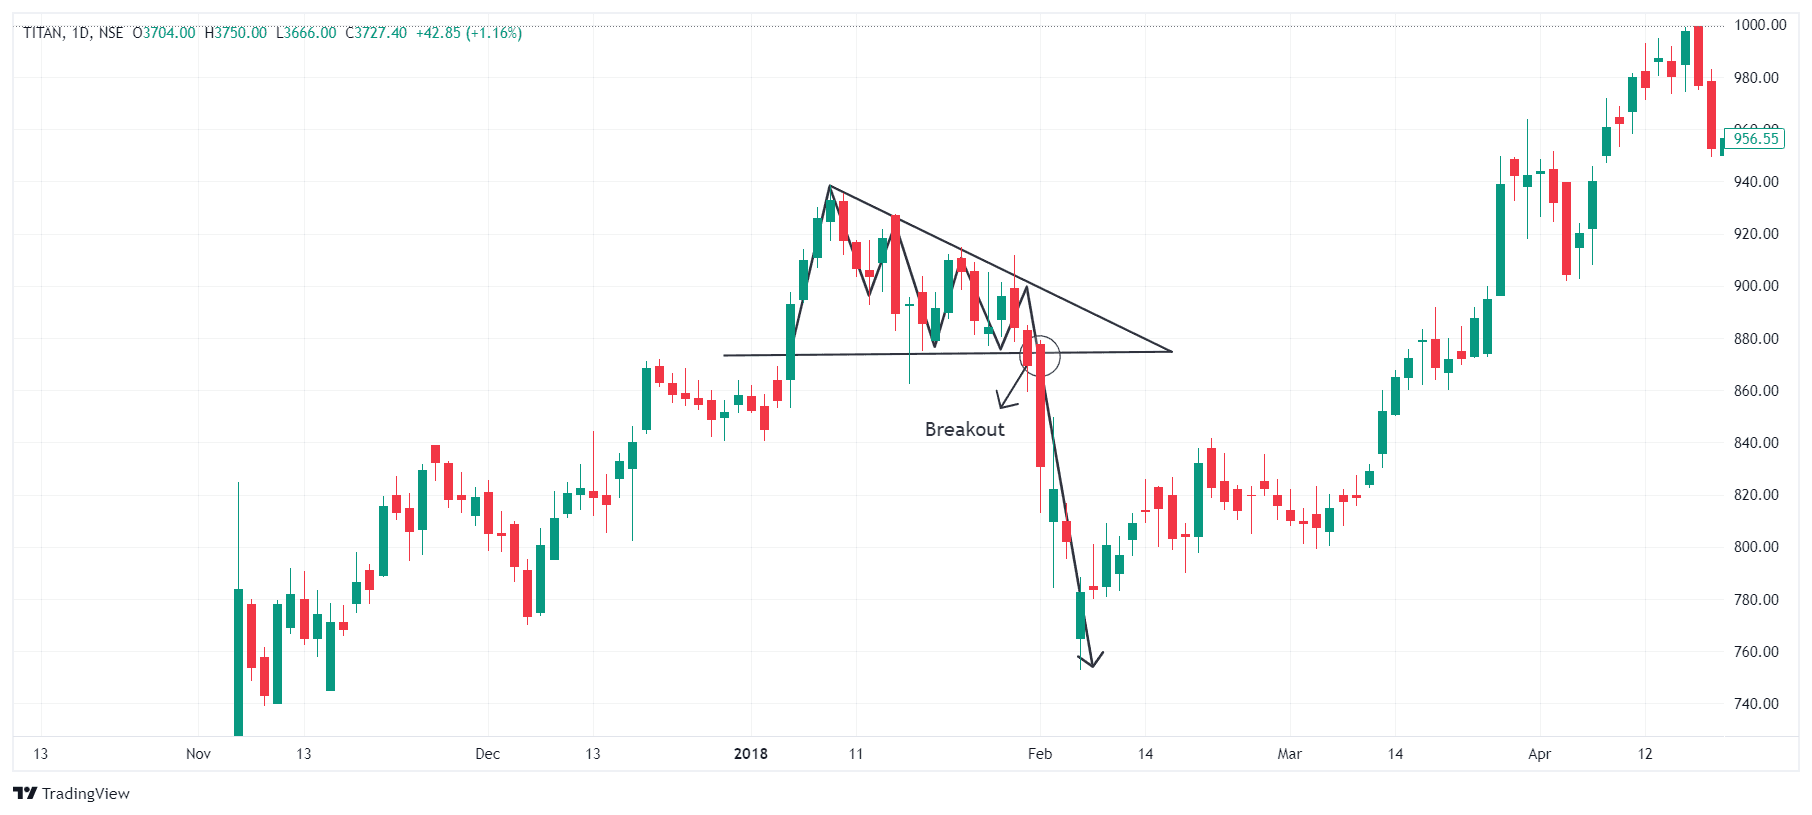
Image Courtesy: Tradingview
Suppose Titan is in a downtrend and forms a Descending Triangle as the price repeatedly finds support at ₹800 but makes lower highs. Eventually, the price breaks below ₹800, confirming the bearish breakout. Traders may enter a short position at the breakdown, expecting further declines.
Confirming Triangle Breakouts
While triangle patterns provide strong indications of potential breakouts, traders often seek confirmation before entering a trade. Here are a few methods for confirming Symmetrical, Ascending, and Descending Triangle breakouts:
-
Volume: A breakout from a triangle pattern is more reliable when accompanied by increasing volume. In a Symmetrical Triangle, high volume during the breakout adds confidence to the trade direction. Similarly, in Ascending and Descending Triangles, rising volume confirms the strength of the breakout.
-
Moving Averages: If the breakout occurs above or below a key moving average (such as the 50-day or 200-day moving average), it can provide additional confirmation of the trend continuation.
-
RSI (Relative Strength Index): The RSI can help confirm the breakout. In a bullish breakout, the RSI should ideally show that the asset is not overbought, while in a bearish breakout, the RSI should not indicate oversold conditions.
How Traders Use Triangle Patterns?
Traders use triangle patterns to identify entry and exit points. Here’s how they typically use these patterns:
-
Symmetrical Triangle: Traders wait for the price to break out of the narrowing range and enter a trade in the direction of the breakout.
-
Ascending Triangle: Traders usually buy at the breakout above the resistance level, expecting a continuation of the uptrend.
-
Descending Triangle: Traders typically short or sell when the price breaks below the support level, anticipating further declines.
In all cases, traders set stop-loss orders to manage risk and protect their capital if the breakout fails.
Conclusion
Triangle patterns are valuable tools in technical analysis, helping traders identify potential continuation or reversal signals. The Symmetrical Triangle is neutral and can break out in either direction, while the Ascending Triangle has a bullish bias, and the Descending Triangle signals a bearish continuation.
By combining these patterns with volume analysis, moving averages, and technical indicators like the RSI, traders can confirm the strength of the breakout and make more informed decisions. Whether you're looking for a bullish or bearish signal, triangle patterns offer clear, actionable insights into market behaviour.
In the next chapter, we will explore Wedges, Flags, and Pennants: Key Continuation and Reversal Patterns, which help traders identify market pauses and potential trend continuation or reversal opportunities.
Recommended Courses for you


Learn, Invest, and Grow with Kotak Videos
Explore our comprehensive video library that blends expert market insights with Kotak's innovative financial solutions to support your goals.

Trading with collateral as margin with Kotak Neo

How India is Redefining Space Exploration

