


Kotak
Stockshaala
Chapter 4 | 5 min read
Dow Theory
Now, imagine you’re driving in a new city, and after a few hours on the road, you notice a pattern—certain roads are always busy, others less so, and some roads connect to major highways that lead you to new areas. Just like in city traffic, the stock market follows patterns and moves in predictable ways. These movements and patterns form the basis of what we call Dow Theory.
Dow Theory is one of the oldest and most fundamental concepts in Technical Analysis (TA), laying the foundation for understanding market trends. This theory, developed by Charles H. Dow in the late 19th century, explains how markets move in phases and trends, helping traders anticipate future movements. In this chapter, we’ll explore the core principles of Dow Theory and how it helps traders navigate market trends with greater confidence.
What is Dow Theory?
Dow Theory is based on the idea that the market moves in waves or trends and that traders can predict future price movements by studying these trends. The theory is built on six core principles that explain how the market operates. It focuses on three types of trends: primary, secondary, and minor.
Let’s break these principles down step by step to understand how they guide traders.
1. The Market Moves in Trends
The core idea of Dow Theory is that the stock market follows trends—much like how traffic patterns follow predictable routes. These trends are not random but are driven by the collective actions of buyers and sellers. The theory defines three types of trends:
- Primary Trend: This is the main direction of the market and lasts for months or even years. It can either be an uptrend (bull market) or a downtrend (bear market).
- Secondary Trend: Secondary trends are shorter-term movements within the primary trend that typically last a few weeks or months. In an uptrend, they are often temporary pullbacks or corrections, and in a downtrend, they are temporary rallies.
- Minor Trend: These are the daily or weekly fluctuations that occur within the primary and secondary trends. They are often less significant but can still impact day-to-day trading decisions.
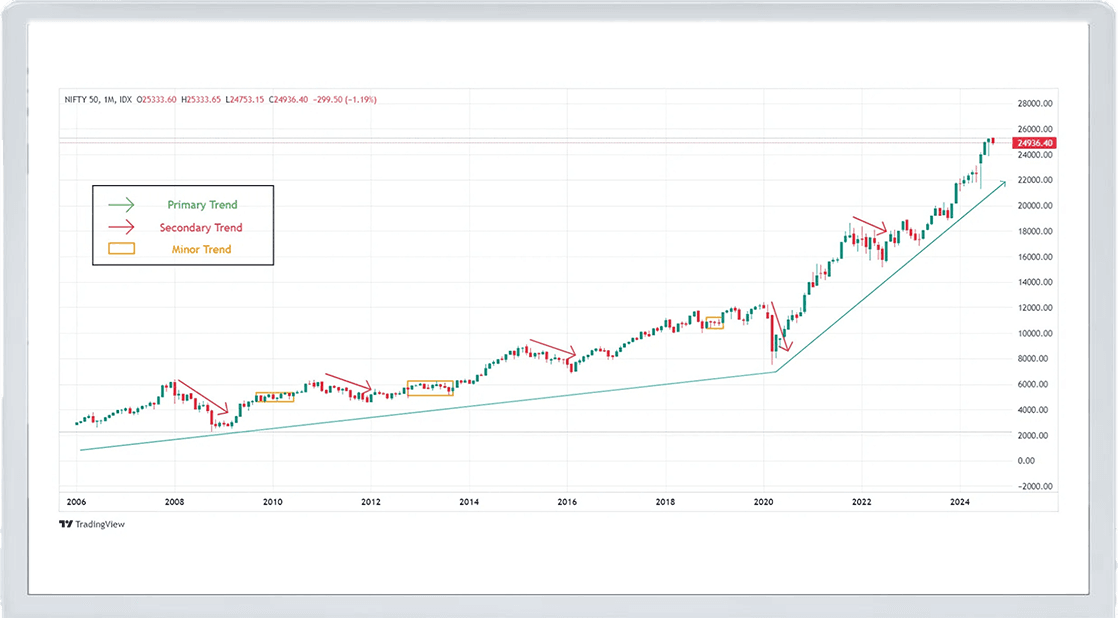
Image Courtesy: Tradingview
Much like following a highway for the majority of your trip (primary trend), you might encounter detours or smaller roads (secondary and minor trends) along the way. Understanding these trends helps traders navigate the market’s ups and downs more smoothly.
The next step in Dow Theory is understanding how the market trends develop over time, which is where the concept of market phases comes in.
2. The Market Has Three Phases
According to Dow Theory, each primary trend has three distinct phases:
- Accumulation Phase: This is the early stage of a trend when informed investors begin to buy or sell a stock. During an uptrend, prices may still be low, but intelligent investors are accumulating stocks in anticipation of higher prices.
- Public Participation Phase: This is the middle stage, where most investors begin to notice the trend. As more participants enter the market, the stock’s price rises (in an uptrend) or falls (in a downtrend) significantly.
- Distribution Phase: This is the final stage, where experienced investors start selling their positions to lock in profits. The broader public might still be buying, but the trend is nearing its end.
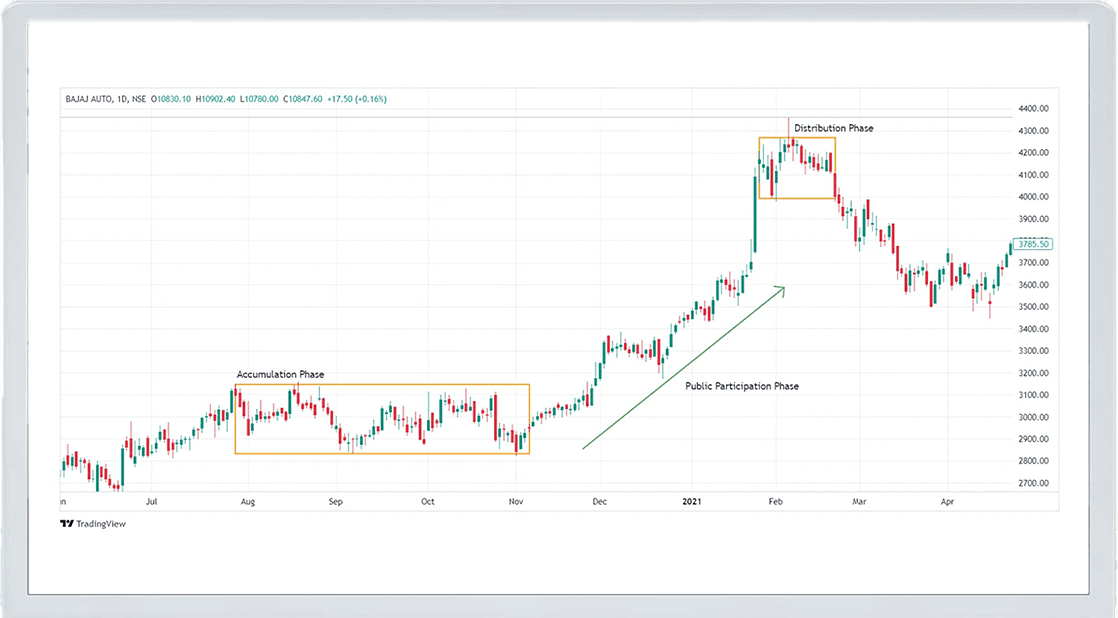
Image Courtesy: Tradingview
Imagine you’re on a road trip, and during the accumulation phase, only a few cars are joining the highway. During the public participation phase, the road is crowded with cars all going in the same direction. Finally, in the distribution phase, the highway starts to clear out as drivers exit.
These phases help traders determine where they are within a trend and whether it’s time to enter or exit the market. But how do we confirm that a trend is real? That’s where Dow Theory’s next principle comes in.
3. Market Indexes Must Confirm Trends
Dow believed that to confirm the validity of a trend, different market indexes must move in the same direction. In his time, this meant that the Dow Jones Industrial Average and the Dow Jones Transportation Average needed to align. If both were rising, it confirmed an uptrend; if both were falling, it confirmed a downtrend.
This principle applies to various indexes and sectors in today's markets. For example, if both the Nifty 50 and the Sensex are moving upward, it’s a vital sign that the broader Indian market is in an uptrend. However, if one index rises while another falls, it suggests uncertainty and may not confirm the trend.
Next, let’s discuss how volume plays a key role in confirming trends.
4. Volume Confirms the Trend
In Dow Theory, trading volume is considered crucial to confirming a trend. Volume refers to the number of shares traded in the market. If a trend is genuine, the volume should increase in the direction of the trend:
- In an uptrend, the volume should increase as prices rise.
- In a downtrend, the volume should increase as prices fall.
If the price is moving in a certain direction but volume is low, it could be a sign that the trend is weak and may reverse soon.
Imagine you’re driving on a busy road, and the traffic starts thinning out—this could indicate that the road is clearing up, and the initial flow of cars might have been temporary. Similarly, low volume during a price movement signals that the trend may not be strong enough to continue.
But how long will the trend last? Dow Theory suggests that trends remain in place until a clear reversal signal occurs.
5. Trends Continue Until Reversal
According to Dow Theory, a trend remains intact until clear signals indicate a reversal. This is one of the most important concepts for traders to remember. The market often moves in waves, and short-term corrections or rallies should not be mistaken for the end of a trend.
For instance, during an uptrend, the stock price may temporarily fall, but until a significant reversal is confirmed, the uptrend is considered to be ongoing. Similarly, during a downtrend, a brief rise in prices does not necessarily mean the trend is over.
Just like following the main road on a trip, occasional bumps or stops don’t mean the road has ended—they are simply part of the journey.
Finally, let’s look at how trends reflect economic conditions.
6. The Market Reflects All Information
Dow believed that the stock market reflects all available information, including economic data, political events, and investor sentiment. This is similar to the concept of efficient markets, where stock prices incorporate all known factors. As new information becomes available, it’s quickly factored into the market, and trends adjust accordingly.
For traders, this means that watching the market’s behaviour gives valuable insight into broader economic trends. Just like observing how cars on a busy road behave can give clues about traffic conditions, watching how markets move can reveal necessary information about the overall economy.
Conclusion and Looking Ahead
Now that you understand the foundation of market trends, you're better equipped to spot the opportunities. Dow Theory provides traders with a solid foundation for understanding market trends and helps guide decisions on when to enter or exit trades. By following its six key principles market trends, phases, index confirmation, volume, reversals, and reflection of information—traders can better predict where the market might be headed.
One of the most important aspects of TA is the analysis of Volumes. In the next chapter we will have a look in detail.
Recommended Courses for you


Learn, Invest, and Grow with Kotak Videos
Explore our comprehensive video library that blends expert market insights with Kotak's innovative financial solutions to support your goals.

Trading with collateral as margin with Kotak Neo

How India is Redefining Space Exploration

