What Is Paying for India's Best GDP Number
- Updated: 11 Sep 2026, 5:38 PM IST
- | 6 min read
- 6,664
 Add Preferred News Source
Walk into any electronics store in India today and a refrigerator bought on a no-cost EMI looks exactly the same as one paid for in cash.
The shopkeeper records a sale. The manufacturer records output.
The transporter moves another appliance.
And gross domestic product (GDP, the broadest measure of economic activity) records all of it.
The economy does not ask where the money came from.
But household balance sheets do.
India's latest GDP number came in at 7.8% for the April to June quarter.
It is the sort of figure that should end an argument.
Instead, it has started several, with much of the debate turning on methodology, the new GDP series and what the headline really tells us.
Set that debate aside. Assume the economy really is growing at that pace.
The more useful question may be: what is paying for that growth?
Because somewhere beneath the GDP headline sits a rather less cheerful number.
Indian households had gross financial liabilities of ₹158.5 lakh crore by March 2026, equivalent to 45.8% of GDP.
Their financial assets were much larger, at ₹490.3 lakh crore, but liabilities have been rising faster than assets as a share of the economy since 2022.
That makes India’s growth story slightly more complicated than the 7.8% headline suggests.
The economy is expanding, consumption is rising, and investment is holding up.
But households are also borrowing more, particularly through retail and unsecured credit.
So perhaps the useful question is not simply how fast India is growing, but how much of today's demand is being supported by tomorrow's income.
The 7.8% GDP number is real
Source: Business Standard
There is no need to throw out the good news simply because the balance sheet deserves scrutiny.
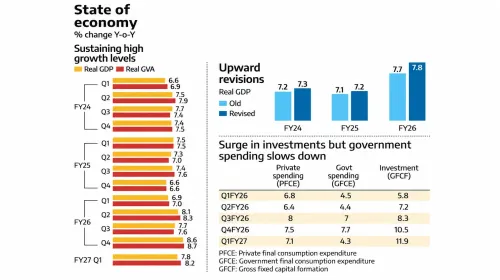
Real GDP grew 7.8% year-on-year in Q1 FY27, ahead of the Reserve Bank of India's (RBI) earlier 7% projection and up from a revised 6.9% in Q1 FY26.
More importantly, the growth was reasonably broad-based.
Private final consumption expenditure (PFCE, the standard measure of household spending) rose 7.1%.
Gross fixed capital formation (the economy's investment in machinery, infrastructure and buildings) increased 11.9%.
Manufacturing expanded 9.2%, and the services sector grew 10%.
This is not simply a story of households borrowing money and spending it.
Investment, manufacturing and services are contributing materially.
The reason to look at household credit is narrower and more useful: what happens to domestic demand when borrowing becomes an increasingly important source of spending power?
The household balance sheet has changed
The RBI’s household financial-stock data provide the counterpoint to the GDP headline.
By March 2026, gross household financial assets were ₹490.28 lakh crore, or 141.6% of GDP.
Gross financial liabilities stood at ₹158.48 lakh crore, or 45.8% of GDP.
Between June 2022 and March 2026, liabilities rose by around 9.4 percentage points of GDP, compared with a 7.4 percentage-point increase in financial assets.
One number doing the rounds deserves a correction.
The 12.4% figure widely cited is gross household financial assets as a share of GDP, not net savings.
After deducting financial liabilities, net financial assets were 6.2% of GDP.
The distinction matters.
Households are still building financial assets, but borrowing is offsetting a meaningful part of that accumulation.
And the composition of borrowing makes the story more interesting.
The changing shape of household credit
A related but distinct measure, household debt (which uses a slightly different methodology from the stock-based financial liabilities figure above), reached 45.5% of GDP as of September 2025, according to the RBI's Financial Stability Report, above its five-year average of 42.9%.
By March 2026, non-housing retail loans accounted for 58.4% of household borrowings.
These include personal loans, credit cards and other consumer-oriented credit.
The expansion of formal credit is not automatically a bad thing.
In fact, the scale of financial inclusion is striking.
Overview of India’s Retail Credit Access March 2017 vs March 2026
(Data for 2017 calculated basis the borrower base in March 2017, while data for 2026 is based on the borrower base of March 2026.)
Source: TransUnion CIBIL
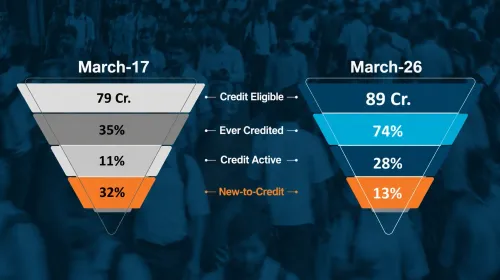
The share of India’s credit-eligible population that was credit-active rose from 11% in March 2017 to 28% in March 2026, while the credit-eligible population itself grew from 79 crore to 89 crore.
Among credit-active consumers, those holding consumption products such as personal loans, credit cards and consumer durable loans increased from 34% to 51%.
The number of consumers with these products quadrupled.
That is credit inclusion doing what it is supposed to do.
The concern begins when borrowing starts replacing income or savings rather than financing an asset or productive activity.
The clearest place to see that shift is small-ticket credit.
Where credit is growing fastest
For personal loans below ₹50,000, fintech lenders held 56.8% of the market in March 2026. Credit in the segment had grown 41.6% year-on-year, versus 20.1% for the overall segment.
Banks accounted for 10.1%, and Non-Banking Financial Companies (NBFCs), including housing finance companies, 30.7%.
The risk indicators are less comfortable.
Delinquencies (loans where repayment has fallen significantly overdue) on fintech- originated small-ticket personal loans were 6.4%, compared with 5.7% for NBFCs and 4.1% for banks.
About 70.5% of fintech lenders’ books were unsecured, with roughly half of those loans going to borrowers below 35.
Across the broader unsecured retail book, gross Non-Performing Assets (NPAs) rose to 1.8% in March 2026 from 1.2% a year earlier. Secured retail loans were at 0.7%.
Credit Information Bureau (India) Limited, or CIBIL, also found that over-leveraged consumer originations rose from 5% in FY17 to 18% in FY24, before easing to 15% in FY26 following industry and regulatory intervention.
The increase was particularly concentrated among younger borrowers.
This is not evidence that every consumer loan is a problem.
It is evidence that the risk profile of incremental credit deserves more attention.
GDP does not care how you paid for the refrigerator
There is an important distinction here.
GDP measures economic activity, not the quality of the financing behind it.
If someone buys a refrigerator through an instalment loan, its production, distribution and sale contribute to GDP just as they would if the buyer paid cash.
The issue comes later.
If credit expands faster than household income and savings, some of today’s consumption is effectively borrowed from tomorrow.
Repayments then take up part of future income, potentially leaving less room for future spending.
That matters because credit-led consumption can look remarkably healthy until the supply of credit slows.
There are already signs that India’s credit expansion is entering a different phase.
The credit-active consumer base grew at a 14% compound annual growth rate between March 2017 and March 2019, but that slowed to 9% between March 2024 and March 2026.
The rapid expansion from bringing new borrowers into the formal system may therefore be slowing.
The next phase depends more on whether existing borrowers can take on credit responsibly and whether that borrowing generates productive economic activity.
The credit cycle is not uniform
This does not, however, resemble the banking stress seen in previous credit cycles.
Scheduled commercial banks entered this period with considerably stronger balance sheets.
Their gross NPA ratio (the share of loans where repayment has stalled) was 1.8% in March 2026, net NPAs were 0.4%, the capital adequacy ratio (which measures a bank's capital buffer against its risk-weighted exposures) was 17.7%, and common equity tier 1 capital (the highest-quality layer of that buffer) was 15.3%.
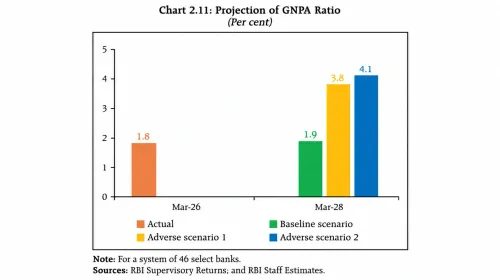
The RBI's stress tests project the aggregate gross NPA ratio at 1.9% by March 2028 under the baseline scenario, and between 3.8% and 4.1% even under severe adverse conditions.
Source: The Reserve Bank of India
So this is not a story about the banking system as a whole.
It is that different parts of the credit market carry different levels of sensitivity.
A home loan and a ₹30,000 unsecured personal loan are very different forms of borrowing.
The lender, borrower, collateral and repayment dynamics differ.
And when credit conditions shift, those differences tend to surface.
Where monetary policy meets household credit
As of early August 2026, the repo rate (the rate at which the RBI lends to commercial banks) stood at 5.25%.
Lower borrowing costs can support consumption and investment.
But the transmission of easier financial conditions does not stop with productive investment.
It can also influence the pace and composition of consumer borrowing.
In November 2023, the RBI increased risk weights (the capital banks must hold against certain exposures) on unsecured personal loans, credit-card receivables and certain NBFC lending.
Unsecured-credit growth moderated for a time, although demand has since recovered.
The question is familiar to most central banks: how to support growth without inadvertently accelerating the kinds of borrowing that could create balance-sheet stress later.
What investors could watch
The 7.8% GDP number does not need to be dismissed or worshipped.
It needs another number beside it.
7.8% tells us how fast the economy grew.
45.8% tells us how large household financial liabilities had become relative to it.
The question for the quarters ahead is whether India can sustain strong consumption while household leverage stops rising faster than the economy.
Because GDP tells us how much India produced.
Household balance sheets tell us something about how much of that demand can be sustained.
Sources and References:
- THEPRINT
- EPW
- BUSINESSSTANDARD
- PIB
- RBI
- BHARATNOTES
- SCRIBD
- TRANSUNIONCIBIL
- INDIANEXPRESS
- ECONOMICTIMES
- MONEYCONTROL
This article is for informational purposes only and does not constitute financial advice. It is not produced by the desk of the Kotak Securities Limited Research Team, nor is it a report published by the Kotak Securities Limited Research Team. The information presented is compiled from several secondary sources available on the internet and may change over time. Investors should conduct their own research and consult with financial professionals before making any investment decisions. The above images were generated using AI. Read the full disclaimer here.
Investments in securities market are subject to market risks, read all the related documents carefully before investing. Brokerage will not exceed SEBI prescribed limit. The securities are quoted as an example and not as a recommendation. Registered Office: 27 BKC, C 27, G Block, Bandra Kurla Complex, Bandra (E), Mumbai 400051. Kotak Securities Limited; SEBI Registration No. INZ000200137(Member of NSE, BSE, MSE, MCX & NCDEX), Member Id: NSE-08081; BSE-673; MSE-1024; MCX-56285; NCDEX-1262. For compliance T&C and disclaimers, Visit bitly link.
0 people liked this article.