What is Short Build Up in the Stock Market? Meaning, Example & How To Identify it
- Updated: 16 Oct 2026, 11:12 AM IST
- | 4m
- 1,077
 Add Preferred News Source
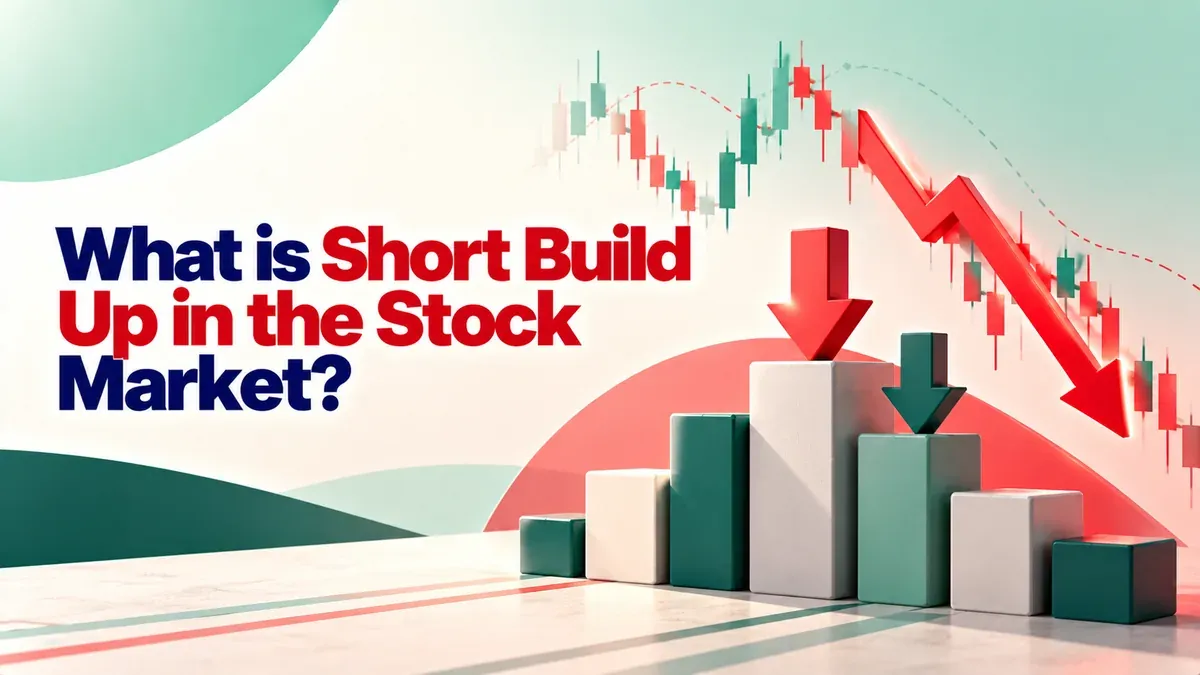
A falling stock is easy to spot. Knowing why it is falling takes more than the price chart. This is where futures data becomes useful. When prices keep slipping and Open Interest (OI) keeps rising, it often means traders are adding new short positions instead of exiting existing ones. That combination is called a short build up. It shows that sellers still expect the downtrend to continue. For anyone tracking derivatives, price and OI together offer a simple way to judge market sentiment.
What is Short Build Up?
Picture a stock that has been slipping for days. Every session ends a little weaker than the last. At the same time, the number of open futures contracts keeps growing instead of dropping. That combination points to a short build up. It means fresh sellers are stepping into the futures market rather than closing old positions.
New contracts continue to get added, which pushes open interest higher. Prices are still moving lower. Put those two together, and it suggests sellers are in control, at least for now. The pressure is coming from new bearish positions, not traders walking away.
Even so, this is rarely enough to make a trading decision by itself. Most traders wait for extra confirmation before treating it as a reliable bearish sign. They usually look at price action, volume, or other supporting clues first. Without that confirmation, the setup can lose strength faster than it first appears.
How Does Short Build Up Work?
A trader expects the stock to fall. So they sell futures at the current market price. The plan is simple. If prices move lower later, they buy the same futures back for less and pocket the difference.
When more traders expect the same decline, they add fresh short positions in the futures market. These are new contracts, not existing ones being closed. The more contracts that are active overall, the higher the open interest.
More traders enter, and selling pressure increases. Every fresh short position adds to that pressure. The stock can keep moving lower while new sellers continue entering. This lasts until traders start buying back their positions or the overall market view changes.
Features of Short Build Up
A short build up leaves a few clear signs behind. None of them should be viewed on their own. Put together, they reveal how traders are positioning themselves and whether selling pressure is starting to take control.
-
The stock keeps losing value even as open interest continues to rise.
-
Sellers keep adding fresh contracts instead of leaving their positions.
-
Bearish sentiment begins to shape how the market views the stock.
-
Buying interest is too weak to absorb the ongoing selling.
-
More traders enter the trade, increasing the number of open contracts.
-
This pattern can appear in both individual stock futures and broader index futures.
-
Most traders also compare volume trends with price charts before treating them as a reliable signal.
Example of Short Build Up
Start with a futures contract trading at ₹1,000. Open interest stands at 50,000 contracts.
After a few sessions, the price falls to ₹960. Open interest, however, climbs to 65,000.
The lower price is the first signal. Sellers have taken control. Now look at open interest. It is rising instead of falling. That changes the story. Traders are not exiting old positions. They are adding new ones.
Those fresh positions are mostly on the short side. In simple words, more participants are betting that prices will continue moving lower.
That is why both numbers should always be read together. Price alone only shows direction. Open interest explains whether new money is supporting that move.
This example makes a short build up meaning easy to understand. Price drops. Open interest grows. Fresh short positions increase. The expectation is for more downside.
Difference Between Short Build Up and Long Build Up
Price alone never tells the full story. What matters is what traders are doing behind the move. That is where short build up and long build up start to look very different. The comparison below makes those differences easy to spot.
Basis | Short Build Up | Long Build Up |
|---|---|---|
Price Movement | Falls | Rises |
Open Interest | Increases | Increases |
Market Sentiment | Bearish | Bullish |
Trader Activity | Fresh short positions are created | Fresh long positions are created |
Market Expectation | Further downside is expected | Further upside is expected |
What Does Short Build Up Indicate to Traders?
A short build up often points to growing bearish sentiment. Traders see it as a sign of greater confidence among sellers. Even after the price has gone down, there are still new short positions that keep appearing. That matters. It shows many participants still expect lower prices instead of waiting for a rebound.
Still, this signal rarely stands on its own. Most experienced traders look beyond it before making a decision. They check support and resistance levels. They watch how the volume is behaving. Chart patterns also help shape the bigger picture. Each piece adds context. Looking at it all together provides a better view of where the market might go next. Using just one signal typically discards relevant information.
How Traders use Short Build Up in Trading Strategies
Most traders fold this signal into a broader plan rather than acting on it alone. Here's roughly how it gets used in practice:
-
Stocks with steadily building selling pressure become easier to spot with this signal..
-
A breakdown below support carries more weight once OI confirms the move is real
-
Price action and OI movement, read side by side, give a clearer sense of trend strength.
-
Entries often get timed around key technical levels rather than random price points.
-
Stop losses come into play here too, keeping potential losses contained.
-
Many traders won't act on the signal alone, pairing it with moving averages or RSI instead.
-
The pattern needs to hold across a few sessions before most traders will commit to a new position.
Conclusion
Short build up shows where traders are putting their bets in the futures market. It reflects growing confidence on the bearish side. As prices fall and open interest keeps rising, new short positions are generally being built into the market. That combination is often a sign of rising selling pressure, not just traders closing out older positions. Still, this is only one piece of the picture. Open interest alone cannot explain everything happening in a stock. Trading volume matters. Price movement matters too. Other chart signals also help fill the gaps that open interest leaves behind. Looking at all of them together gives a clearer view of what is driving the stock. It also helps traders judge market direction with more confidence.
The content in this blog is intended purely for educational purposes. Any securities or mutual funds referenced are illustrative in nature and do not constitute a recommendation or endorsement by Kotak Neo. Investors are encouraged to assess their own financial situation and seek professional advice before making any investment decisions. For compliance T&C and disclaimers, Visit https://www.kotakneo.com/disclaimer
0 people liked this article.

Vishwa has spent 10+ years across fintech and FMCG doing what most people miss, connecting the dots, catching trends before they trend, and finding the angle nobody else thought to ask about.
At Kotak Neo, she drives content strategy for neoshorts, Kotak News Desk, and Investing Guide, turning market noise into something worth reading.
When she's not decoding markets, she trades charts for canvases, chasing art, painting, and architecture across cities she's yet to explore.